Office Space
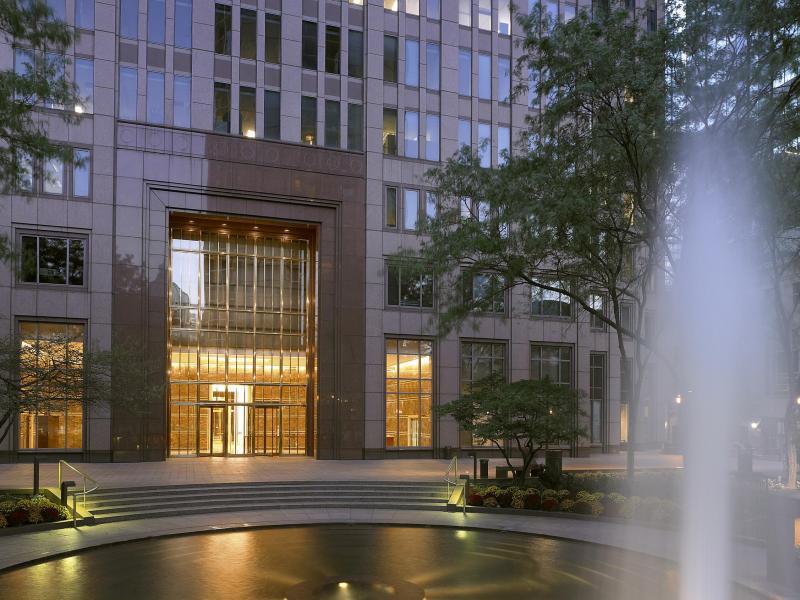
1717 Arch Street Philadelphia, PA 19103
1717 Arch Street Philadelphia, PA 19103
Details & Description
Property Highlights
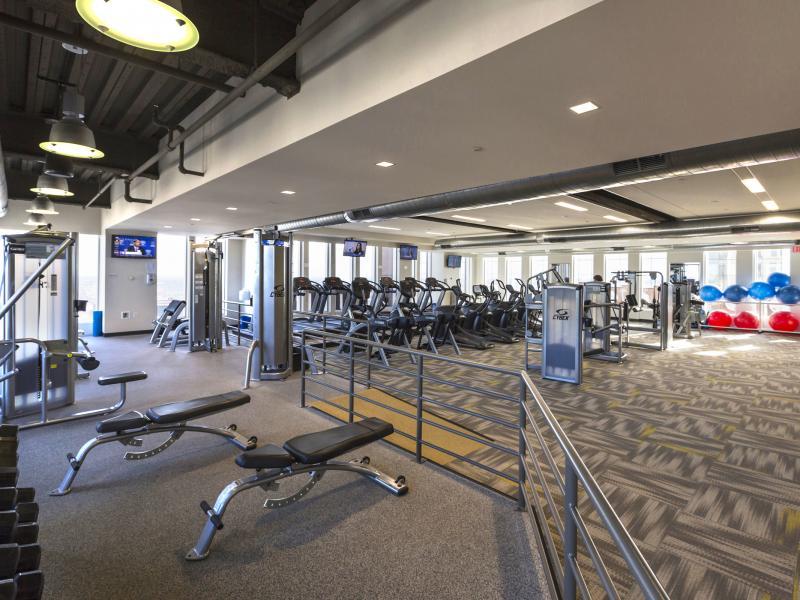
- • Exclusive access to BDN Tenants
- • State-of-the-art technology
- • Exclusive access to BDN Tenants
- • Premium-quality equipment including Peloton Bikes
- • Group exercise classes
- • Personal training options
Listing Agents

Matthew Croce
O: 215-656-4463
matthew.croce@bdnreit.com
O: 215-656-4463
matthew.croce@bdnreit.com
While we strive to provide the most accurate information, all listing information, and demographic data, is provided by third-parties. As such, MyEListing will not be responsible for the accuracy of the information. It is strongly recommended that you verify all information with the listing agent, and any relevant agencies, prior to making any decisions.