Office Space
1900 Market Street Philadelphia, PA 19103
1900 Market Street Philadelphia, PA 19103

Details & Description
Property Highlights
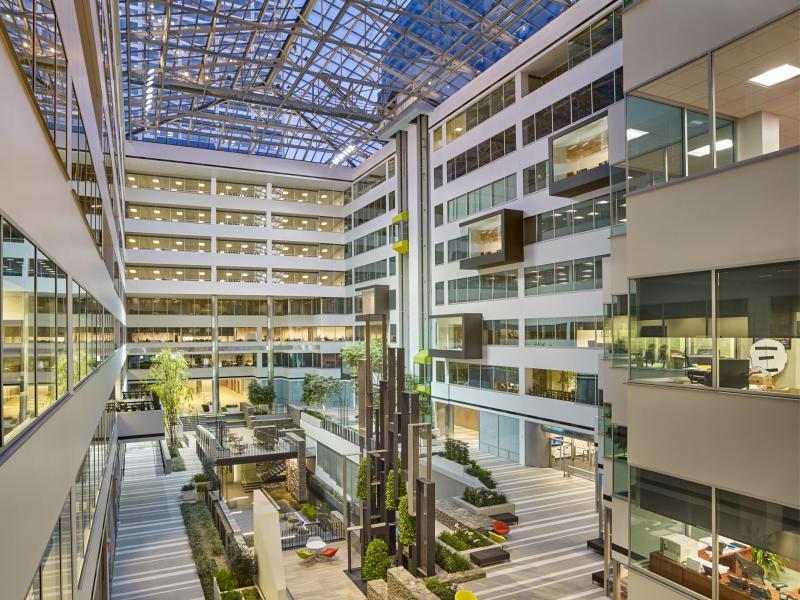
• Soaring eight story glass atrium, filling lobby and tenant space with an abundance of natural light
• Column-free floor plates, providing maximum efficiency
Listing Agents

Matthew Croce
O: 215-656-4463
matthew.croce@bdnreit.com
O: 215-656-4463
matthew.croce@bdnreit.com
While we strive to provide the most accurate information, all listing information, and demographic data, is provided by third-parties. As such, MyEListing will not be responsible for the accuracy of the information. It is strongly recommended that you verify all information with the listing agent, and any relevant agencies, prior to making any decisions.