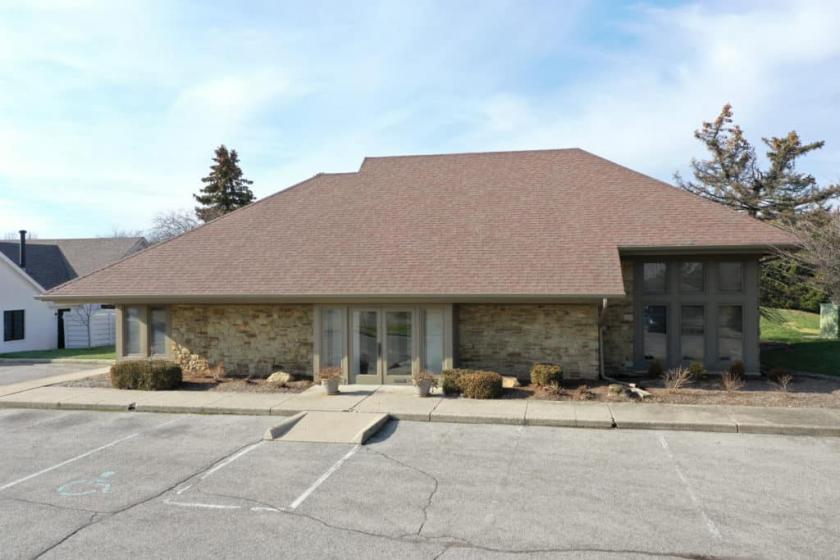
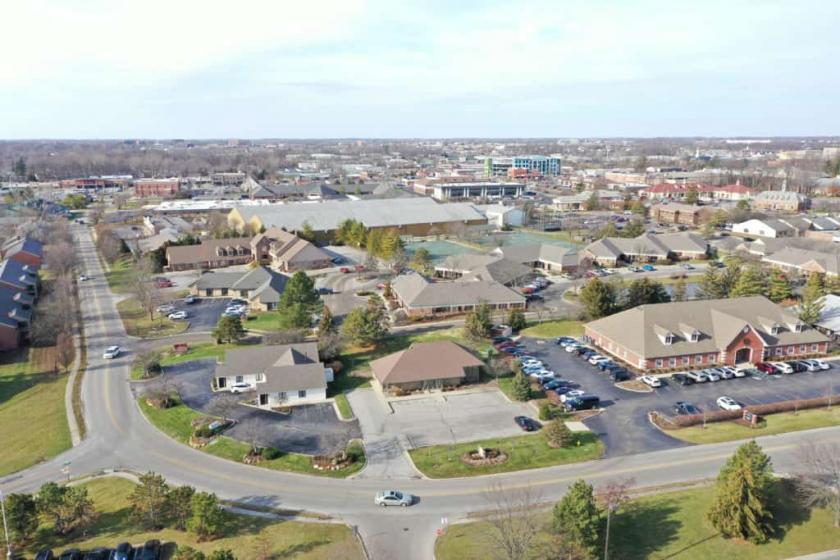
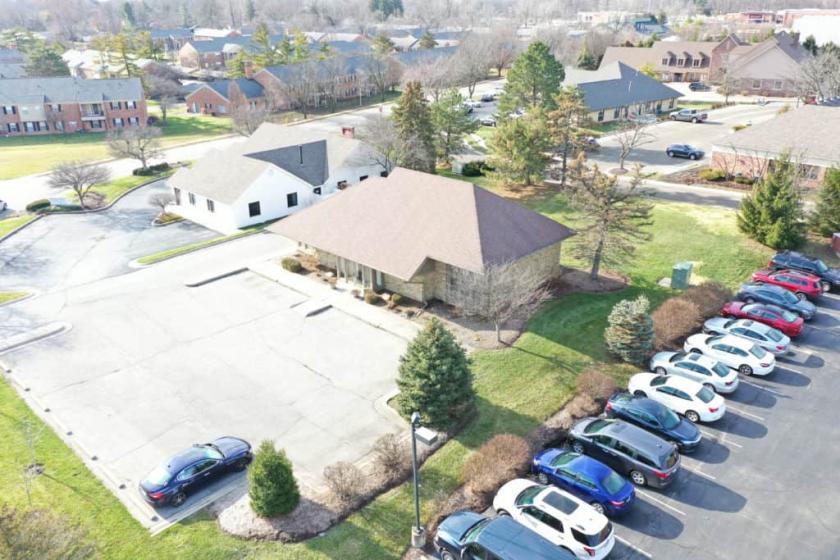
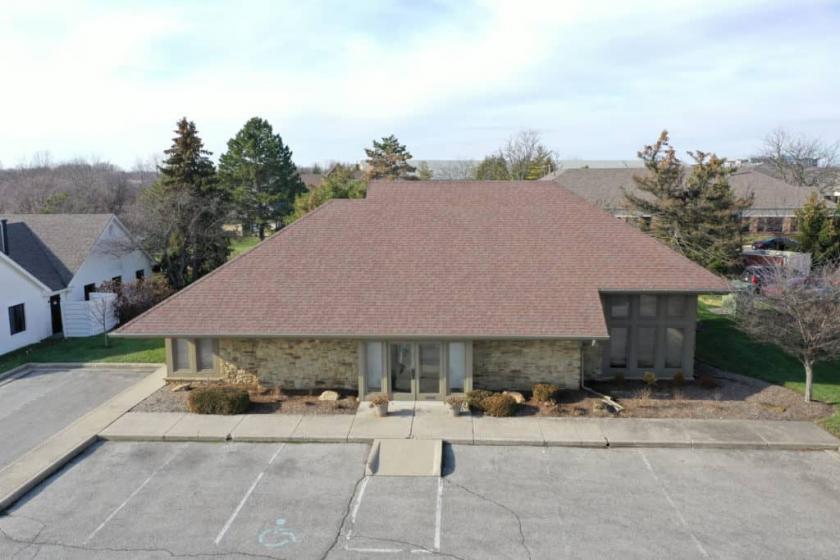
1-Mile | 3-Miles | 5-Miles | ||
---|---|---|---|---|
Total Population | 8,562 | 63,449 | 159,955 | |
Population Median Age | 40 | 40 | 39 | |
Population by Age | 0-9 Yrs | 1083 (12%) | 7119 (11%) | 18444 (11%) |
10-19 Yrs | 983 (11%) | 8497 (13%) | 21803 (13%) | |
20-29 Yrs | 965 (11%) | 7492 (11%) | 19876 (12%) | |
30-39 Yrs | 1420 (16%) | 8703 (13%) | 22650 (14%) | |
40-49 Yrs | 884 (10%) | 9006 (14%) | 21618 (13%) | |
50-59 Yrs | 1093 (12%) | 8483 (13%) | 21536 (13%) | |
60-69 Yrs | 868 (10%) | 7363 (11%) | 17736 (11%) | |
70+ Yrs | 1265 (14%) | 6787 (10%) | 16293 (10%) | |
Median HH Income | $73,549 | $88,421 | $90,428 | |
Total Household Income | < 24K | 371 (10%) | 2518 (9%) | 6694 (10%) |
25-49K | 767 (21%) | 4549 (17%) | 11552 (17%) | |
50-74K | 708 (19%) | 4488 (16%) | 10112 (15%) | |
75-99K | 492 (13%) | 3303 (12%) | 7900 (11%) | |
100-199K | 905 (25%) | 7787 (29%) | 19142 (28%) | |
200K+ | 365 (10%) | 4012 (15%) | 11068 (16%) | |
Highest Education Level | No Diploma | 208 | 1393 | 3109 |
Diploma or GED | 958 | 5255 | 13126 | |
Some College | 955 | 6753 | 16362 | |
Assoc. Degree | 336 | 2551 | 6900 | |
Bachelors Degree | 2212 | 17718 | 43801 | |
Higher Degree | 1300 | 10790 | 28029 | |
Total Housing Units | 4,065 | 28,614 | 71,159 | |
--Owner-Occupied | 2,006 | 16,826 | 43,339 | |
--Renter-Occupied | 1,602 | 9,832 | 23,128 | |
Owner-Occupied Values | < 100K | 160 | 490 | 1375 |
100-199K | 649 | 3679 | 10375 | |
200-299K | 617 | 5462 | 11313 | |
300-399K | 276 | 3897 | 8761 | |
400-499K | 148 | 1575 | 4761 | |
500K+ | 155 | 1723 | 6754 | |
Total Working Age Population | 6,899 | 50,818 | 127,075 | |
In Work Force | 4,673 | 36,249 | 90,829 | |
Not In Work Force | 2,226 | 14,569 | 36,246 | |
Workforce Employed | 4,481 | 35,277 | 88,404 | |
Workforce Unemployed | 192 | 971 | 2,369 | |
Civlian Workforce | 4,673 | 36,248 | 90,773 | |
Military Workforce | 0 | 1 | 56 | |
Total Households | 3,608 | 26,658 | 66,468 | |
Family Households | 2,237 | 16,721 | 41,367 | |
Non-Family Households | 1,371 | 9,937 | 25,101 | |
Married Couple | 1,755 | 14,295 | 34,910 | |
Other Family | 482 | 2,426 | 6,457 | |
Married w/Child | 693 | 6,182 | 15,381 | |
Single Male w/Child | 51 | 297 | 772 | |
Single Female w/Child | 220 | 1,062 | 3,238 |
Population Change Last Two Decades - Plus Projection
2000 | % | 2010 | % | 2020 | % | 2030 | |
---|---|---|---|---|---|---|---|
Indiana | 6,080,485 | +7 | 6,483,802 | +4 | 6,738,573 | +4 | 7,014,880 |
Hamilton County | 182,740 | +50 | 274,569 | +25 | 343,179 | +22 | 417,754 |
Marion County | 860,454 | +5 | 903,393 | +7 | 963,732 | +4 | 1,001,231 |
Total Working Age Population:
Total Households:
Total Working Age Population:
Total Households:
Total Working Age Population:
Total Households: