Industrial Properties
3800 Camp Creek Parkway Atlanta, GA 30344
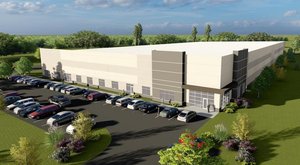
3800 Camp Creek Parkway Atlanta, GA 30344

Details & Description
Property Highlights
- • 61,820-square-foot distribution facility
- • Steel frame and concrete masonry construction
- • 22 minimum clear height
- • Dock-high loading
- • 1.5 auto parking spaces per 1,000 SF
- • Wet sprinkler system
Listing Agents

Wes Hardy
Duke Realty
O: 770-638-2522
wes.hardy@dukerealty.com
Duke Realty
O: 770-638-2522
wes.hardy@dukerealty.com
While we strive to provide the most accurate information, all listing information, and demographic data, is provided by third-parties. As such, MyEListing will not be responsible for the accuracy of the information. It is strongly recommended that you verify all information with the listing agent, and any relevant agencies, prior to making any decisions.