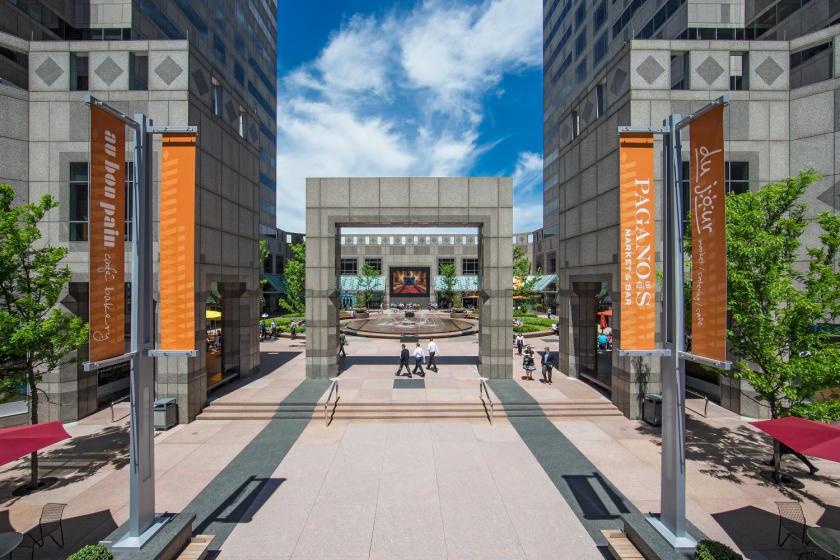
1-Mile | 3-Miles | 5-Miles | ||
---|---|---|---|---|
Total Population | 80,278 | 491,283 | 954,186 | |
Population Median Age | 38 | 36 | 36 | |
Population by Age | 0-9 Yrs | 4214 (5%) | 49086 (9%) | 117406 (12%) |
10-19 Yrs | 5557 (6%) | 52600 (10%) | 118049 (12%) | |
20-29 Yrs | 24519 (30%) | 113103 (23%) | 186567 (19%) | |
30-39 Yrs | 17344 (21%) | 91000 (18%) | 155554 (16%) | |
40-49 Yrs | 6899 (8%) | 49196 (10%) | 102082 (10%) | |
50-59 Yrs | 7055 (8%) | 51110 (10%) | 106991 (11%) | |
60-69 Yrs | 6877 (8%) | 45097 (9%) | 90070 (9%) | |
70+ Yrs | 7812 (9%) | 40091 (8%) | 77468 (8%) | |
Median HH Income | $81,623 | $52,590 | $42,566 | |
Total Household Income | < 24K | 7360 (17%) | 59668 (29%) | 125505 (33%) |
25-49K | 5702 (13%) | 38813 (19%) | 81072 (21%) | |
50-74K | 6476 (15%) | 30703 (15%) | 55073 (14%) | |
75-99K | 5056 (12%) | 20692 (10%) | 35807 (9%) | |
100-199K | 10370 (24%) | 36923 (18%) | 53991 (14%) | |
200K+ | 6791 (16%) | 17245 (8%) | 20978 (5%) | |
Highest Education Level | No Diploma | 2288 | 44990 | 106614 |
Diploma or GED | 5131 | 86984 | 192843 | |
Some College | 4829 | 45665 | 102107 | |
Assoc. Degree | 1748 | 14312 | 30641 | |
Bachelors Degree | 22341 | 80864 | 115611 | |
Higher Degree | 25843 | 71812 | 92917 | |
Total Housing Units | 47,821 | 240,121 | 438,223 | |
--Owner-Occupied | 14,325 | 89,302 | 173,871 | |
--Renter-Occupied | 27,431 | 114,741 | 198,555 | |
Owner-Occupied Values | < 100K | 467 | 16845 | 61572 |
100-199K | 890 | 19029 | 44480 | |
200-299K | 1866 | 17768 | 25303 | |
300-399K | 2630 | 12493 | 15442 | |
400-499K | 1953 | 7473 | 9060 | |
500K+ | 6519 | 15695 | 18014 | |
Total Working Age Population | 74,760 | 417,450 | 771,323 | |
In Work Force | 51,289 | 264,339 | 464,659 | |
Not In Work Force | 23,471 | 153,110 | 306,664 | |
Workforce Employed | 49,667 | 244,030 | 422,224 | |
Workforce Unemployed | 1,578 | 20,123 | 42,217 | |
Civlian Workforce | 51,245 | 264,154 | 464,441 | |
Military Workforce | 44 | 186 | 218 | |
Total Households | 41,757 | 204,043 | 372,426 | |
Family Households | 12,138 | 87,460 | 186,358 | |
Non-Family Households | 29,618 | 116,583 | 186,068 | |
Married Couple | 10,309 | 49,195 | 87,081 | |
Other Family | 1,829 | 38,265 | 99,277 | |
Married w/Child | 2,747 | 16,598 | 31,050 | |
Single Male w/Child | 207 | 2,958 | 8,343 | |
Single Female w/Child | 555 | 14,105 | 39,704 |
Population Change Last Two Decades - Plus Projection
2000 | % | 2010 | % | 2020 | % | 2030 | |
---|---|---|---|---|---|---|---|
New Jersey | 8,414,350 | +4 | 8,791,894 | +4 | 9,132,700 | +4 | 9,530,900 |
Camden County | 508,932 | +1 | 513,657 | 0 | 511,800 | +2 | 521,000 |
Gloucester County | 254,673 | +13 | 288,288 | +1 | 292,000 | +5 | 305,800 |
Pennsylvania | 12,281,054 | +3 | 12,702,379 | +4 | 13,230,170 | +4 | 13,759,594 |
Delaware County | 550,864 | +1 | 558,979 | +5 | 588,436 | +6 | 622,307 |
Montgomery County | 750,097 | +7 | 799,874 | +5 | 838,883 | +6 | 891,868 |
Philadelphia County | 1,517,550 | +1 | 1,526,006 | +8 | 1,653,729 | +6 | 1,753,054 |
Total Working Age Population:
Total Households:
Total Working Age Population:
Total Households:
Total Working Age Population:
Total Households: