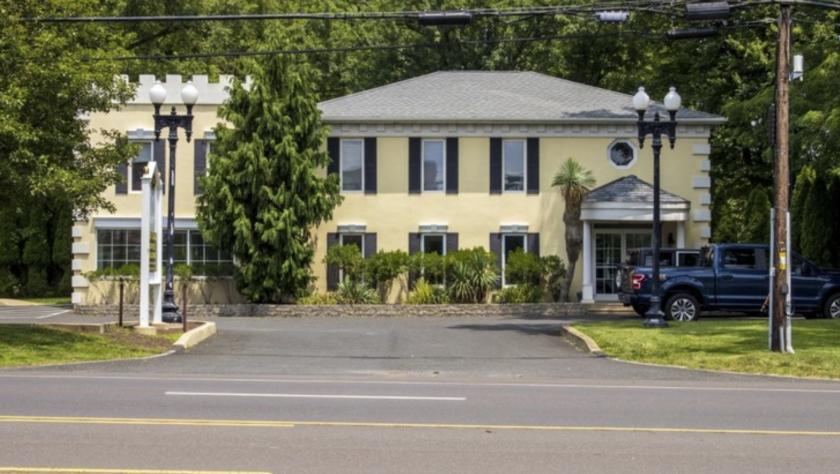
Office Space
1243 Street Road Southampton, PA 18966
1243 Street Road Southampton, PA 18966
Details & Description
Property Highlights
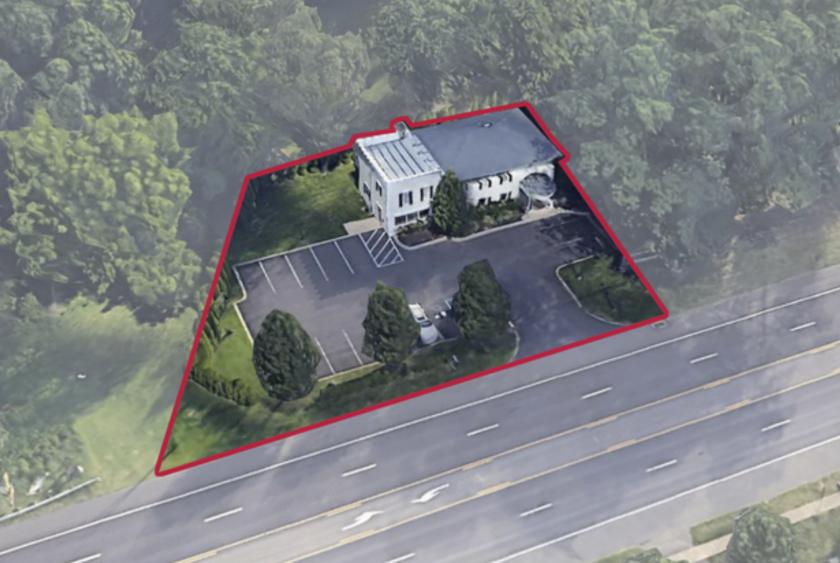
- • Frontage 170 Street Rd Approximate
- • 14 Personal vehicle spaces
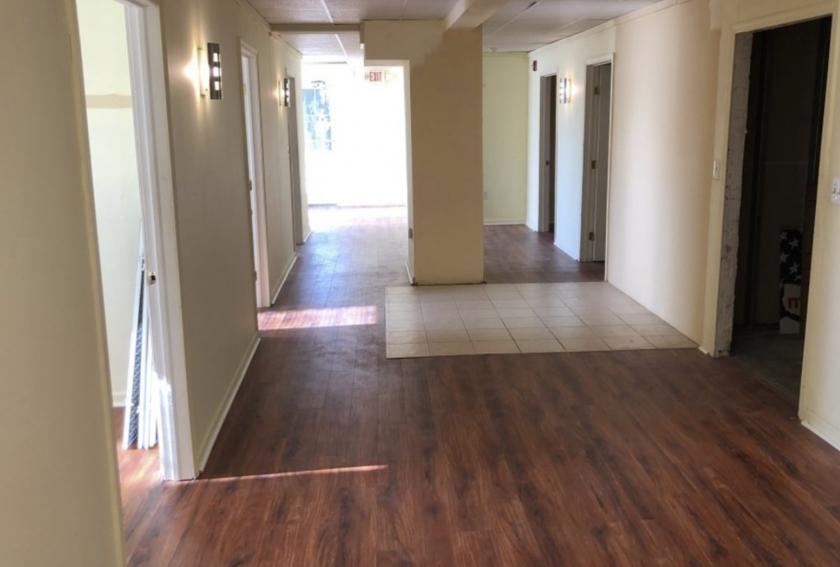
- • Seven 7 Private Offices
- • Taxes $6,753.73 estimated 2020
Listing Agents

Jason Ostach
O: 215-448-6000
jostach@binswanger.com
O: 215-448-6000
jostach@binswanger.com
While we strive to provide the most accurate information, all listing information, and demographic data, is provided by third-parties. As such, MyEListing will not be responsible for the accuracy of the information. It is strongly recommended that you verify all information with the listing agent, and any relevant agencies, prior to making any decisions.