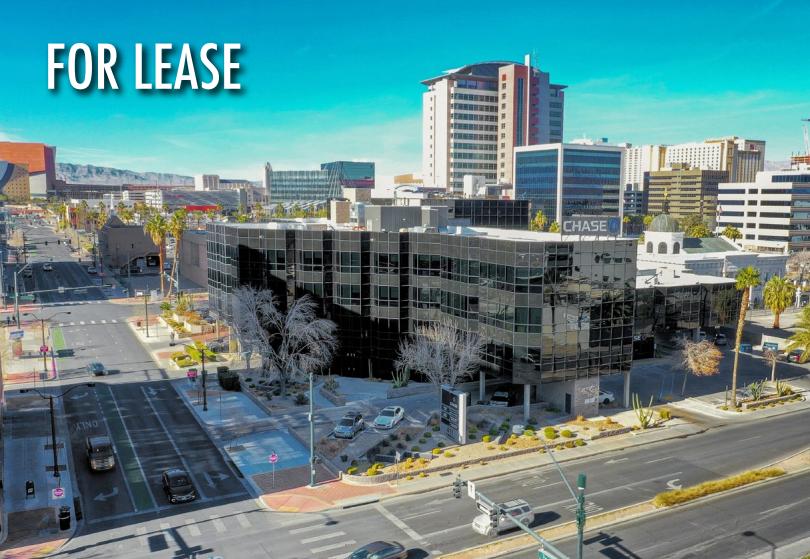
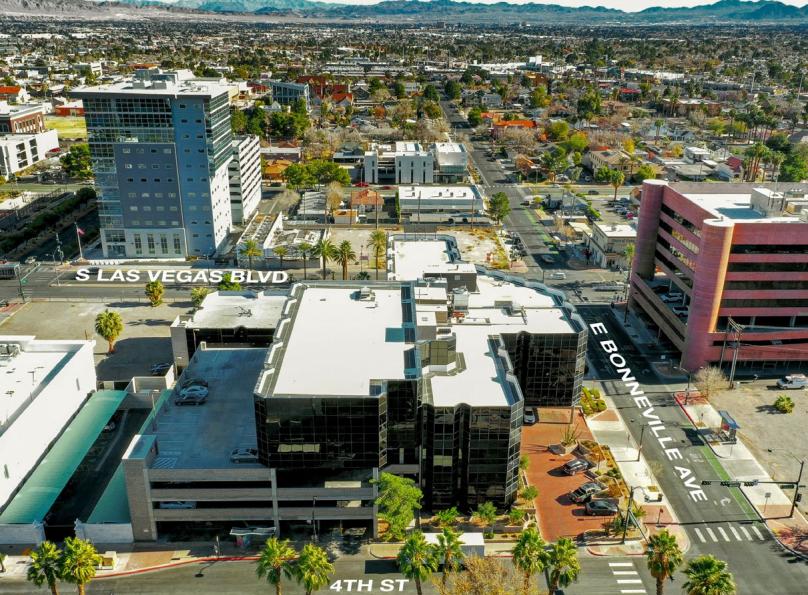
1-Mile | 3-Miles | 5-Miles | ||
---|---|---|---|---|
Total Population | 15,237 | 166,915 | 507,265 | |
Population Median Age | 42 | 37 | 36 | |
Population by Age | 0-9 Yrs | 1040 (6%) | 22605 (13%) | 71077 (14%) |
10-19 Yrs | 1067 (7%) | 22133 (13%) | 70823 (13%) | |
20-29 Yrs | 2535 (16%) | 24896 (14%) | 77850 (15%) | |
30-39 Yrs | 2889 (18%) | 23115 (13%) | 71163 (14%) | |
40-49 Yrs | 2112 (13%) | 21979 (13%) | 67616 (13%) | |
50-59 Yrs | 2328 (15%) | 21636 (12%) | 61918 (12%) | |
60-69 Yrs | 1898 (12%) | 17278 (10%) | 47041 (9%) | |
70+ Yrs | 1368 (8%) | 13273 (7%) | 39777 (7%) | |
Median HH Income | $25,836 | $32,272 | $37,572 | |
Total Household Income | < 24K | 3120 (49%) | 24477 (40%) | 59574 (33%) |
25-49K | 1467 (23%) | 16877 (27%) | 53574 (29%) | |
50-74K | 715 (11%) | 8770 (14%) | 30645 (17%) | |
75-99K | 349 (5%) | 4615 (7%) | 16369 (9%) | |
100-199K | 578 (9%) | 5033 (8%) | 16114 (8%) | |
200K+ | 131 (2%) | 1246 (2%) | 2888 (1%) | |
Highest Education Level | No Diploma | 2410 | 32218 | 91947 |
Diploma or GED | 3850 | 34434 | 106978 | |
Some College | 3099 | 22923 | 68970 | |
Assoc. Degree | 699 | 5668 | 17689 | |
Bachelors Degree | 1487 | 10283 | 30082 | |
Higher Degree | 531 | 4352 | 12368 | |
Total Housing Units | 8,162 | 75,135 | 216,399 | |
--Owner-Occupied | 1,191 | 18,662 | 60,776 | |
--Renter-Occupied | 5,169 | 42,356 | 118,389 | |
Owner-Occupied Values | < 100K | 214 | 3979 | 12747 |
100-199K | 432 | 7533 | 25821 | |
200-299K | 324 | 4213 | 14803 | |
300-399K | 102 | 1115 | 3688 | |
400-499K | 65 | 645 | 1478 | |
500K+ | 54 | 1175 | 2239 | |
Total Working Age Population | 13,587 | 130,176 | 391,965 | |
In Work Force | 5,991 | 76,503 | 244,465 | |
Not In Work Force | 7,596 | 53,673 | 147,501 | |
Workforce Employed | 5,315 | 69,163 | 222,685 | |
Workforce Unemployed | 656 | 7,280 | 21,450 | |
Civlian Workforce | 5,971 | 76,443 | 244,135 | |
Military Workforce | 21 | 60 | 330 | |
Total Households | 6,360 | 61,018 | 179,165 | |
Family Households | 1,831 | 31,538 | 100,645 | |
Non-Family Households | 4,529 | 29,480 | 78,519 | |
Married Couple | 1,003 | 16,393 | 54,271 | |
Other Family | 828 | 15,145 | 46,374 | |
Married w/Child | 329 | 6,832 | 23,714 | |
Single Male w/Child | 90 | 2,121 | 6,451 | |
Single Female w/Child | 248 | 5,952 | 17,548 |
Population Change Last Two Decades - Plus Projection
2000 | % | 2010 | % | 2020 | % | 2030 | |
---|---|---|---|---|---|---|---|
Nevada | 1,998,257 | +35 | 2,700,551 | +17 | 3,149,234 | +10 | 3,460,728 |
Clark County | 1,375,765 | +42 | 1,951,269 | +19 | 2,318,174 | +10 | 2,550,048 |
Nye County | 32,485 | +35 | 43,946 | +11 | 48,864 | +8 | 52,587 |
Total Working Age Population:
Total Households:
Total Working Age Population:
Total Households:
Total Working Age Population:
Total Households: