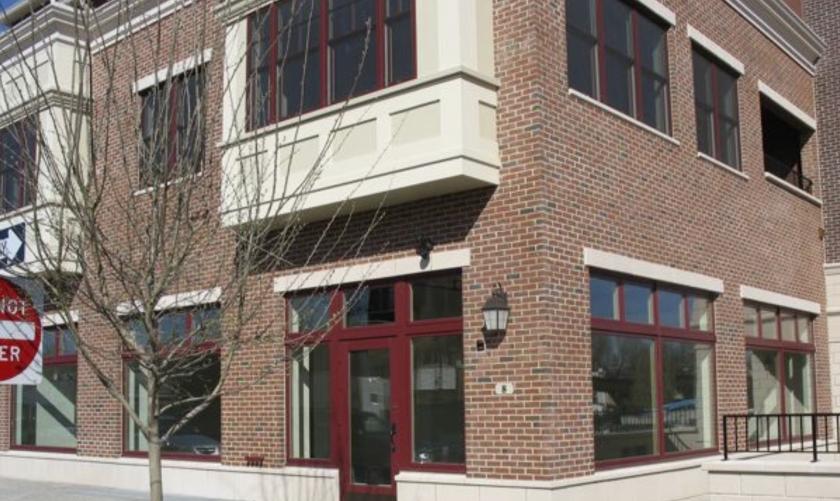
1-Mile | 3-Miles | 5-Miles | ||
---|---|---|---|---|
Total Population | 20,309 | 162,382 | 410,338 | |
Population Median Age | 41 | 38 | 38 | |
Population by Age | 0-9 Yrs | 2246 (11%) | 22251 (13%) | 51428 (12%) |
10-19 Yrs | 1956 (9%) | 21989 (13%) | 47235 (11%) | |
20-29 Yrs | 2415 (11%) | 20779 (12%) | 58820 (14%) | |
30-39 Yrs | 3253 (16%) | 22669 (13%) | 67515 (16%) | |
40-49 Yrs | 2851 (14%) | 20343 (12%) | 50054 (12%) | |
50-59 Yrs | 3045 (14%) | 22324 (13%) | 52858 (12%) | |
60-69 Yrs | 2564 (12%) | 16890 (10%) | 42949 (10%) | |
70+ Yrs | 1980 (9%) | 15138 (9%) | 39480 (9%) | |
Median HH Income | $82,183 | $58,156 | $66,023 | |
Total Household Income | < 24K | 1405 (16%) | 15307 (25%) | 33246 (21%) |
25-49K | 1273 (14%) | 11688 (19%) | 29609 (18%) | |
50-74K | 1391 (16%) | 9081 (15%) | 24296 (15%) | |
75-99K | 910 (10%) | 6618 (10%) | 19380 (12%) | |
100-199K | 2619 (30%) | 13163 (21%) | 37209 (23%) | |
200K+ | 1063 (12%) | 4586 (7%) | 13915 (8%) | |
Highest Education Level | No Diploma | 685 | 16312 | 39698 |
Diploma or GED | 3409 | 31862 | 80927 | |
Some College | 2591 | 20354 | 48187 | |
Assoc. Degree | 1134 | 7291 | 17567 | |
Bachelors Degree | 4348 | 20177 | 61372 | |
Higher Degree | 3047 | 12355 | 41377 | |
Total Housing Units | 9,645 | 68,064 | 176,004 | |
--Owner-Occupied | 5,120 | 35,879 | 95,084 | |
--Renter-Occupied | 3,541 | 24,564 | 62,570 | |
Owner-Occupied Values | < 100K | 171 | 8047 | 13471 |
100-199K | 1197 | 11178 | 33008 | |
200-299K | 2205 | 9112 | 24855 | |
300-399K | 1032 | 3558 | 10961 | |
400-499K | 350 | 1614 | 4476 | |
500K+ | 165 | 2370 | 8313 | |
Total Working Age Population | 16,842 | 126,206 | 329,479 | |
In Work Force | 12,145 | 82,476 | 219,695 | |
Not In Work Force | 4,697 | 43,730 | 109,784 | |
Workforce Employed | 11,466 | 75,992 | 205,051 | |
Workforce Unemployed | 676 | 6,411 | 14,428 | |
Civlian Workforce | 12,143 | 82,403 | 219,479 | |
Military Workforce | 3 | 73 | 216 | |
Total Households | 8,661 | 60,443 | 157,654 | |
Family Households | 5,104 | 39,881 | 95,212 | |
Non-Family Households | 3,556 | 20,562 | 62,442 | |
Married Couple | 3,869 | 23,038 | 60,990 | |
Other Family | 1,235 | 16,843 | 34,222 | |
Married w/Child | 1,611 | 9,412 | 24,128 | |
Single Male w/Child | 124 | 1,455 | 3,747 | |
Single Female w/Child | 404 | 7,349 | 12,715 |
Population Change Last Two Decades - Plus Projection
2000 | % | 2010 | % | 2020 | % | 2030 | |
---|---|---|---|---|---|---|---|
New Jersey | 8,414,350 | +4 | 8,791,894 | +4 | 9,132,700 | +4 | 9,530,900 |
Burlington County | 423,394 | +6 | 448,734 | 0 | 450,000 | +3 | 464,900 |
Camden County | 508,932 | +1 | 513,657 | 0 | 511,800 | +2 | 521,000 |
Gloucester County | 254,673 | +13 | 288,288 | +1 | 292,000 | +5 | 305,800 |
Pennsylvania | 12,281,054 | +3 | 12,702,379 | +4 | 13,230,170 | +4 | 13,759,594 |
Montgomery County | 750,097 | +7 | 799,874 | +5 | 838,883 | +6 | 891,868 |
Philadelphia County | 1,517,550 | +1 | 1,526,006 | +8 | 1,653,729 | +6 | 1,753,054 |
Total Working Age Population:
Total Households:
Total Working Age Population:
Total Households:
Total Working Age Population:
Total Households: