Retail Space
1550 North Pacific Highway Woodburn, OR 97071
1550 North Pacific Highway Woodburn, OR 97071
Details & Description
Property Highlights
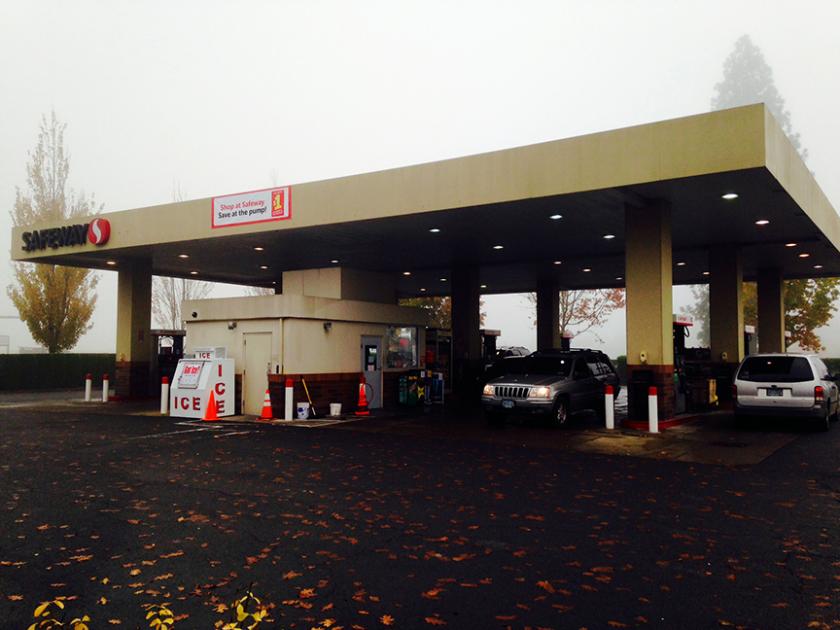
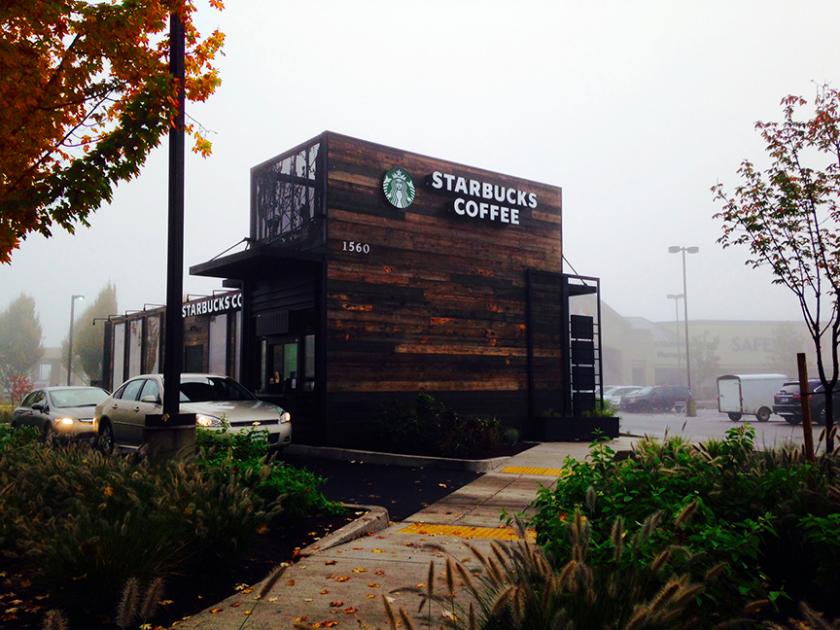
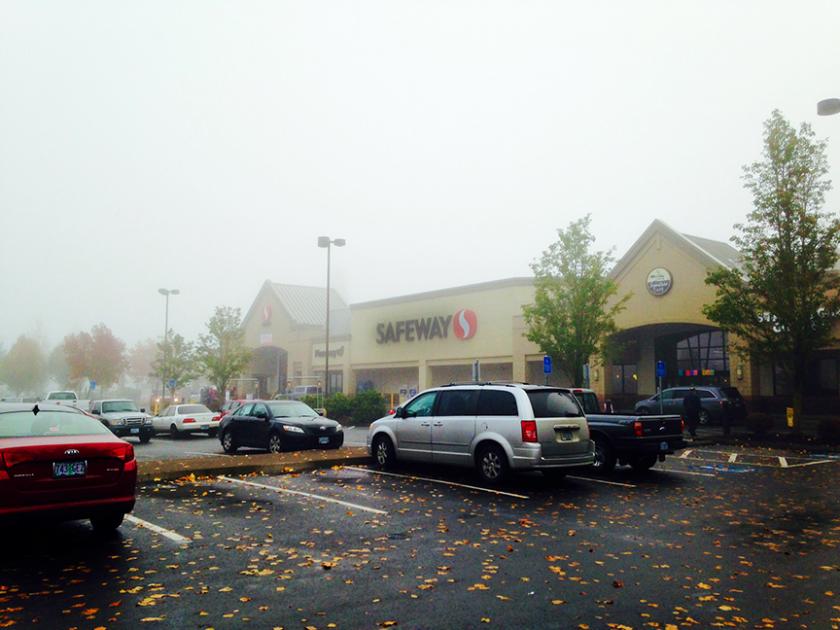
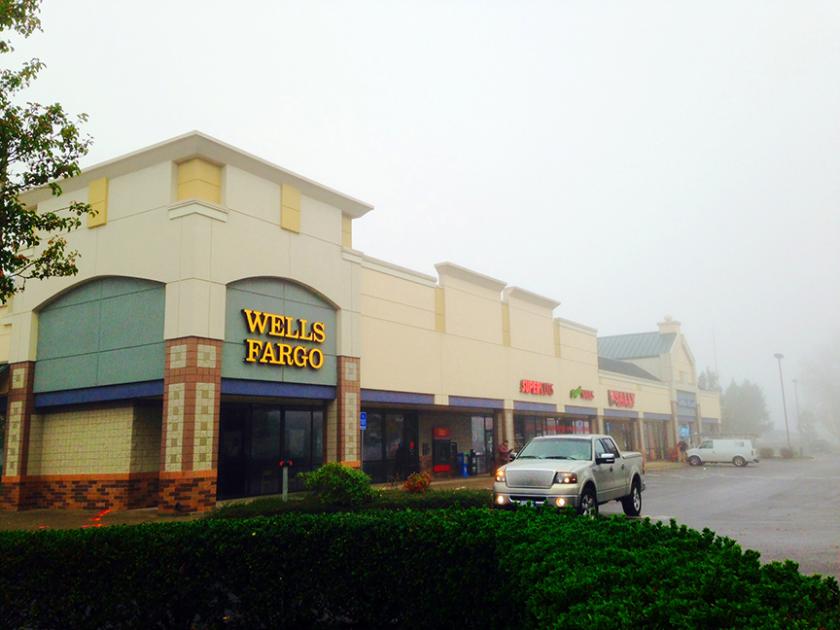
• The Woodburn Safeway Center is located at Woodburns primary commercial intersection and is anchored by Safeway.
• Co-tenants include Starbucks, Sherwin Williams, Sally Beauty, Wells Fargo, Supercuts, Safeway Fuel, and others.
Additional Photos
Listing Agents

Jeff Olson
O: 503-595-7567
M: 503-957-1452
jeff@cra-nw.com
O: 503-595-7567
M: 503-957-1452
jeff@cra-nw.com

Kelli Maks
CRA Northwest LLC
O: 503-595-7565
M: 503-680-3765
kelli@cra-nw.com
CRA Northwest LLC
O: 503-595-7565
M: 503-680-3765
kelli@cra-nw.com
While we strive to provide the most accurate information, all listing information, and demographic data, is provided by third-parties. As such, MyEListing will not be responsible for the accuracy of the information. It is strongly recommended that you verify all information with the listing agent, and any relevant agencies, prior to making any decisions.


