Office Space
9350 Southwest Washington Square Road Tigard, OR 97223
9350 Southwest Washington Square Road Tigard, OR 97223
Details & Description
Property Highlights
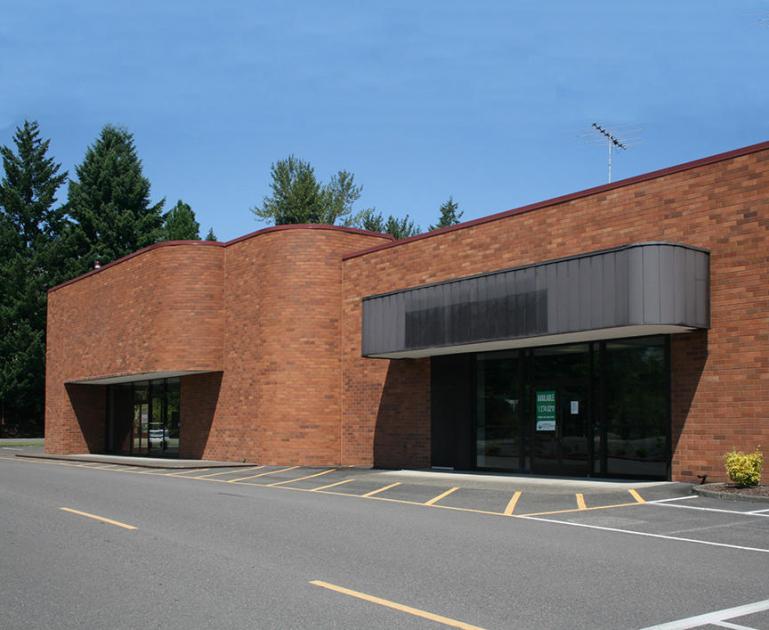
• High visibility location on Hall Blvd adjacent to Washington Square Mall.
• Anchored by Nordstrom, Macys, JCPenney, Apple, and Dicks Sporting Goods.
Listing Agents

Gary Surgeon
O: 503-595-7566
M: 503-936-1989
gary@cra-nw.com
O: 503-595-7566
M: 503-936-1989
gary@cra-nw.com
While we strive to provide the most accurate information, all listing information, and demographic data, is provided by third-parties. As such, MyEListing will not be responsible for the accuracy of the information. It is strongly recommended that you verify all information with the listing agent, and any relevant agencies, prior to making any decisions.


