Retail Space
1405 Jantzen Beach Center Portland, OR 97217
1405 Jantzen Beach Center Portland, OR 97217
Details & Description
Property Highlights
• GLA is 746,171 SF of retail space on 67 acres.
• Abundant parking available 3,472 spaces.
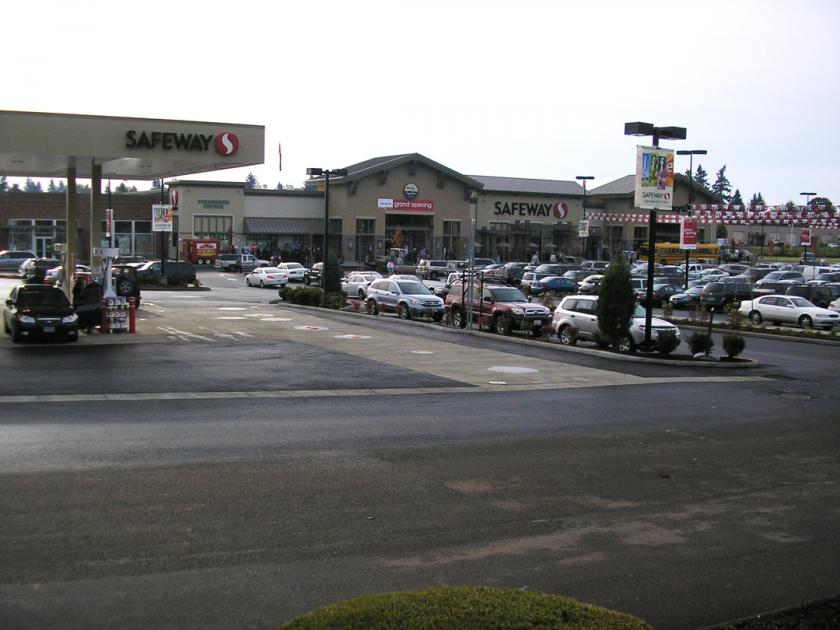
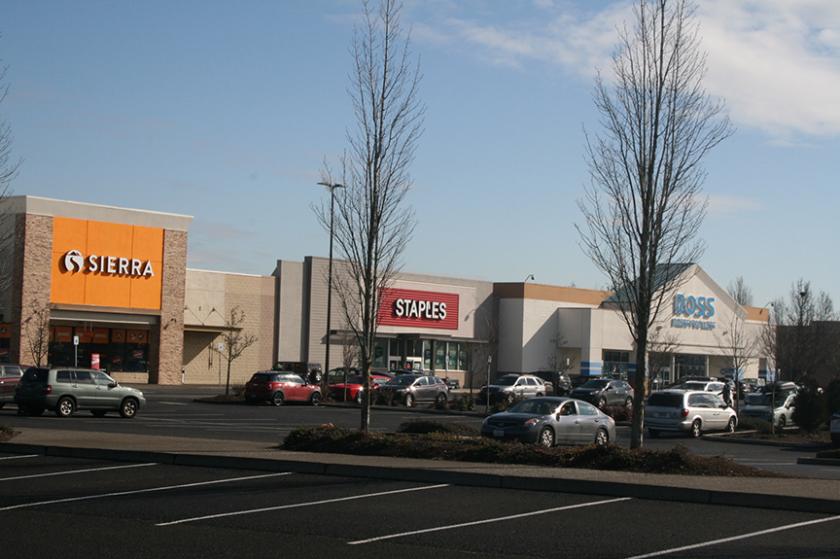
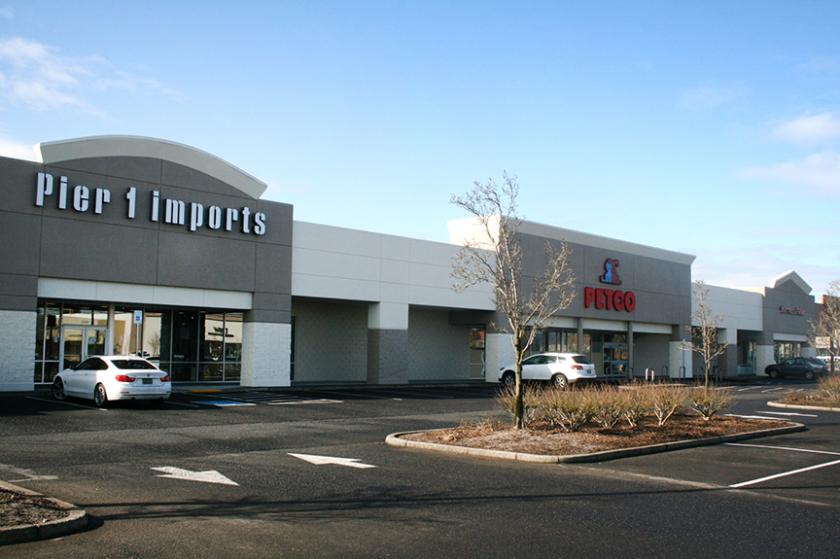
Additional Photos

Listing Agents

Gary Surgeon
O: 503-595-7566
M: 503-936-1989
gary@cra-nw.com
O: 503-595-7566
M: 503-936-1989
gary@cra-nw.com
While we strive to provide the most accurate information, all listing information, and demographic data, is provided by third-parties. As such, MyEListing will not be responsible for the accuracy of the information. It is strongly recommended that you verify all information with the listing agent, and any relevant agencies, prior to making any decisions.


