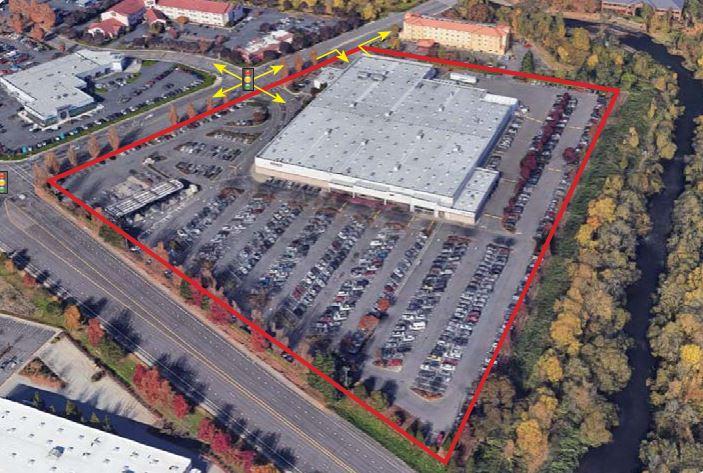
1-Mile | 3-Miles | 5-Miles | ||
---|---|---|---|---|
Total Population | 6,869 | 93,007 | 206,651 | |
Population Median Age | 38 | 37 | 37 | |
Population by Age | 0-9 Yrs | 610 (8%) | 11414 (12%) | 27068 (13%) |
10-19 Yrs | 983 (14%) | 12748 (13%) | 28963 (14%) | |
20-29 Yrs | 1031 (15%) | 15453 (16%) | 31932 (15%) | |
30-39 Yrs | 1091 (15%) | 13663 (14%) | 29567 (14%) | |
40-49 Yrs | 1014 (14%) | 11512 (12%) | 24770 (11%) | |
50-59 Yrs | 772 (11%) | 10409 (11%) | 23126 (11%) | |
60-69 Yrs | 810 (11%) | 10055 (10%) | 23004 (11%) | |
70+ Yrs | 559 (8%) | 7754 (8%) | 18222 (8%) | |
Median HH Income | $45,809 | $50,146 | $55,046 | |
Total Household Income | < 24K | 464 (21%) | 7296 (22%) | 15060 (20%) |
25-49K | 794 (37%) | 8783 (27%) | 18652 (25%) | |
50-74K | 431 (20%) | 6217 (19%) | 14285 (19%) | |
75-99K | 281 (13%) | 4091 (12%) | 9625 (13%) | |
100-199K | 144 (6%) | 5161 (16%) | 13601 (18%) | |
200K+ | 16 (0%) | 687 (2%) | 2247 (3%) | |
Highest Education Level | No Diploma | 958 | 9494 | 19874 |
Diploma or GED | 1765 | 17258 | 33500 | |
Some College | 1474 | 16686 | 36522 | |
Assoc. Degree | 205 | 4913 | 11249 | |
Bachelors Degree | 333 | 8549 | 21100 | |
Higher Degree | 94 | 4321 | 12376 | |
Total Housing Units | 2,286 | 34,709 | 78,340 | |
--Owner-Occupied | 912 | 16,005 | 38,716 | |
--Renter-Occupied | 1,216 | 16,231 | 34,754 | |
Owner-Occupied Values | < 100K | 178 | 1748 | 3166 |
100-199K | 433 | 5843 | 10915 | |
200-299K | 252 | 5486 | 14336 | |
300-399K | 29 | 1846 | 6055 | |
400-499K | 1 | 592 | 2277 | |
500K+ | 19 | 490 | 1966 | |
Total Working Age Population | 5,641 | 74,375 | 162,341 | |
In Work Force | 2,830 | 44,960 | 100,934 | |
Not In Work Force | 2,811 | 29,415 | 61,407 | |
Workforce Employed | 2,630 | 42,212 | 94,808 | |
Workforce Unemployed | 200 | 2,678 | 6,017 | |
Civlian Workforce | 2,830 | 44,890 | 100,825 | |
Military Workforce | 0 | 70 | 109 | |
Total Households | 2,129 | 32,236 | 73,469 | |
Family Households | 1,425 | 19,359 | 46,753 | |
Non-Family Households | 704 | 12,876 | 26,716 | |
Married Couple | 883 | 13,253 | 32,518 | |
Other Family | 542 | 6,106 | 14,235 | |
Married w/Child | 295 | 5,547 | 13,713 | |
Single Male w/Child | 64 | 735 | 2,029 | |
Single Female w/Child | 219 | 2,475 | 6,006 |
Population Change Last Two Decades - Plus Projection
2000 | % | 2010 | % | 2020 | % | 2030 | |
---|---|---|---|---|---|---|---|
Oregon | 3,421,399 | +12 | 3,831,074 | +11 | 4,264,810 | +11 | 4,727,438 |
Marion County | 284,834 | +11 | 315,335 | +11 | 350,125 | +11 | 388,420 |
Polk County | 62,380 | +21 | 75,403 | +13 | 85,012 | +16 | 98,501 |
Total Working Age Population:
Total Households:
Total Working Age Population:
Total Households:
Total Working Age Population:
Total Households: