Office Space
5888 West Sunset Road Las Vegas, NV 89118
5888 West Sunset Road Las Vegas, NV 89118
Details & Description
Property Highlights
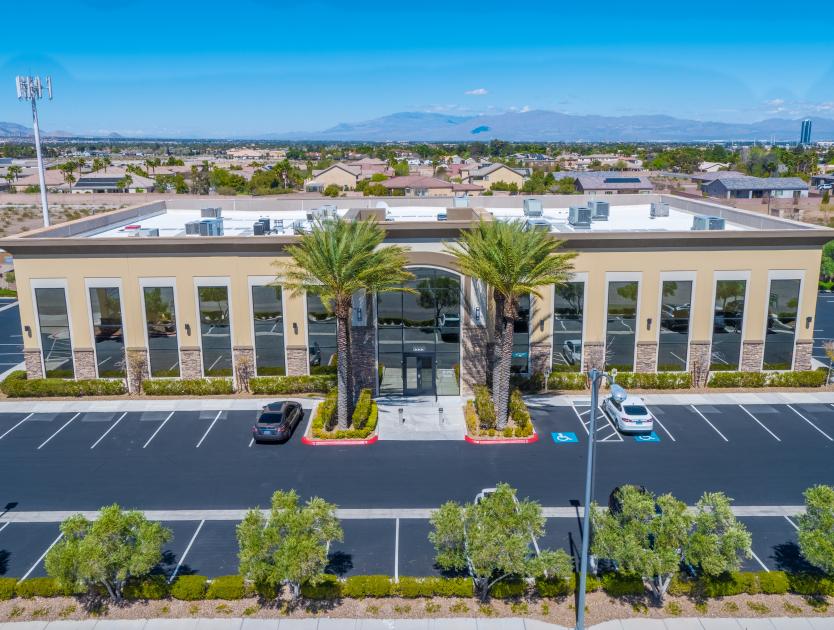
- • Great parking ratio with 5 per 1,000
- • Building and Monument signage available
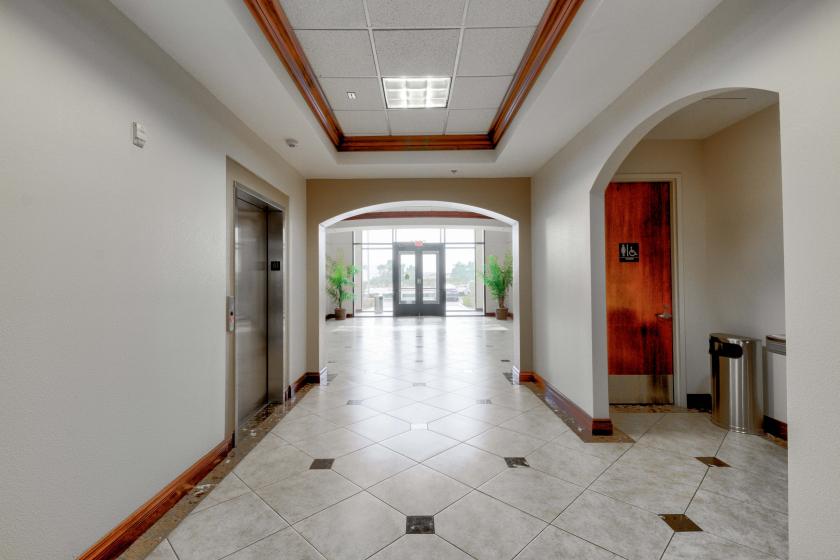
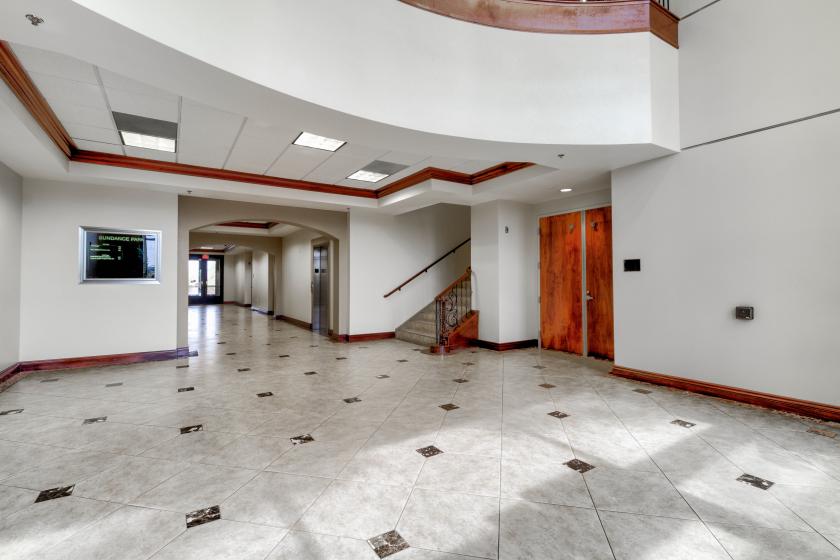
- • Prime 1st floor locations directly off of lobby
- • Minutes from McCarran International Airport
Listing Agents

Ryan Martin
O: 702-388-1800
M: 702-941-7382
rmartin@mdlgroup.com
O: 702-388-1800
M: 702-941-7382
rmartin@mdlgroup.com
While we strive to provide the most accurate information, all listing information, and demographic data, is provided by third-parties. As such, MyEListing will not be responsible for the accuracy of the information. It is strongly recommended that you verify all information with the listing agent, and any relevant agencies, prior to making any decisions.