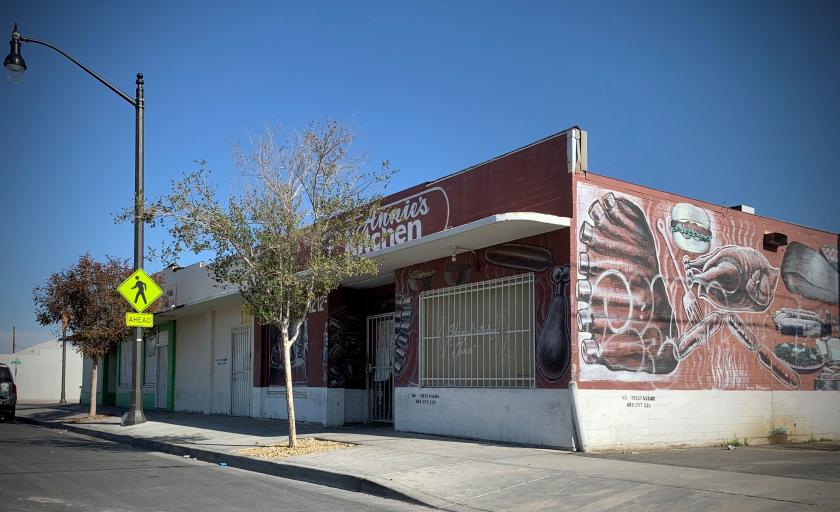
1-Mile | 3-Miles | 5-Miles | ||
---|---|---|---|---|
Total Population | 14,079 | 163,142 | 499,362 | |
Population Median Age | 36 | 35 | 35 | |
Population by Age | 0-9 Yrs | 2039 (14%) | 24150 (14%) | 73783 (14%) |
10-19 Yrs | 1729 (12%) | 24909 (15%) | 72082 (14%) | |
20-29 Yrs | 2427 (17%) | 24066 (14%) | 75741 (15%) | |
30-39 Yrs | 2048 (14%) | 22214 (13%) | 69494 (13%) | |
40-49 Yrs | 1541 (10%) | 21862 (13%) | 66139 (13%) | |
50-59 Yrs | 2009 (14%) | 19622 (12%) | 59810 (11%) | |
60-69 Yrs | 1419 (10%) | 15368 (9%) | 45395 (9%) | |
70+ Yrs | 867 (6%) | 10949 (6%) | 36918 (7%) | |
Median HH Income | $21,718 | $33,727 | $39,271 | |
Total Household Income | < 24K | 2569 (55%) | 20716 (38%) | 53740 (31%) |
25-49K | 1149 (24%) | 14814 (27%) | 49063 (29%) | |
50-74K | 424 (9%) | 8142 (15%) | 29306 (17%) | |
75-99K | 153 (3%) | 4364 (8%) | 17256 (10%) | |
100-199K | 286 (6%) | 4745 (8%) | 16780 (9%) | |
200K+ | 20 (0%) | 932 (1%) | 2472 (1%) | |
Highest Education Level | No Diploma | 2593 | 34513 | 88879 |
Diploma or GED | 2836 | 32413 | 105375 | |
Some College | 2537 | 19791 | 66988 | |
Assoc. Degree | 576 | 4891 | 17644 | |
Bachelors Degree | 468 | 7742 | 26801 | |
Higher Degree | 185 | 2947 | 10880 | |
Total Housing Units | 5,796 | 62,808 | 197,537 | |
--Owner-Occupied | 1,026 | 17,871 | 63,875 | |
--Renter-Occupied | 3,576 | 35,841 | 104,742 | |
Owner-Occupied Values | < 100K | 288 | 3547 | 11602 |
100-199K | 493 | 8071 | 26908 | |
200-299K | 137 | 4129 | 18123 | |
300-399K | 46 | 902 | 4129 | |
400-499K | 28 | 365 | 1146 | |
500K+ | 34 | 857 | 1968 | |
Total Working Age Population | 10,916 | 122,968 | 380,193 | |
In Work Force | 5,327 | 71,581 | 236,777 | |
Not In Work Force | 5,589 | 51,387 | 143,416 | |
Workforce Employed | 4,507 | 64,768 | 215,539 | |
Workforce Unemployed | 821 | 6,667 | 20,677 | |
Civlian Workforce | 5,327 | 71,435 | 236,217 | |
Military Workforce | 0 | 146 | 560 | |
Total Households | 4,602 | 53,712 | 168,617 | |
Family Households | 2,271 | 31,133 | 100,231 | |
Non-Family Households | 2,331 | 22,579 | 68,387 | |
Married Couple | 814 | 16,218 | 55,354 | |
Other Family | 1,457 | 14,916 | 44,877 | |
Married w/Child | 349 | 7,816 | 25,053 | |
Single Male w/Child | 162 | 2,119 | 6,373 | |
Single Female w/Child | 647 | 5,868 | 17,055 |
Population Change Last Two Decades - Plus Projection
2000 | % | 2010 | % | 2020 | % | 2030 | |
---|---|---|---|---|---|---|---|
Nevada | 1,998,257 | +35 | 2,700,551 | +17 | 3,149,234 | +10 | 3,460,728 |
Clark County | 1,375,765 | +42 | 1,951,269 | +19 | 2,318,174 | +10 | 2,550,048 |
Nye County | 32,485 | +35 | 43,946 | +11 | 48,864 | +8 | 52,587 |
Total Working Age Population:
Total Households:
Total Working Age Population:
Total Households:
Total Working Age Population:
Total Households: