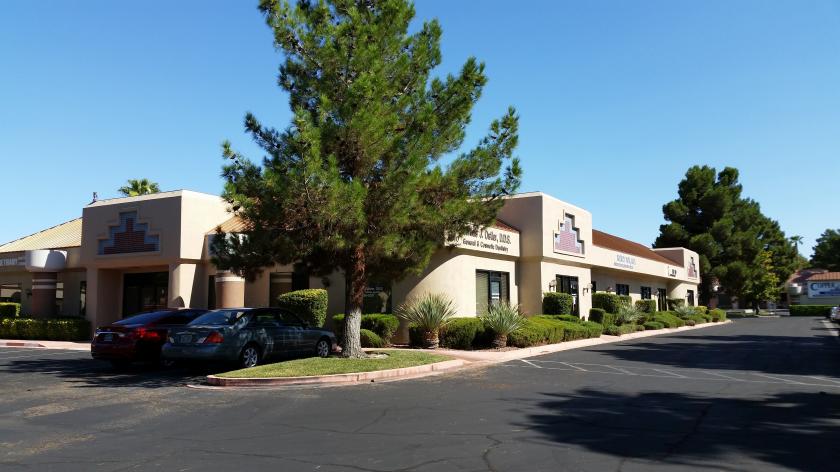
1-Mile | 3-Miles | 5-Miles | ||
---|---|---|---|---|
Total Population | 25,527 | 151,134 | 412,360 | |
Population Median Age | 41 | 39 | 38 | |
Population by Age | 0-9 Yrs | 2603 (10%) | 17158 (11%) | 49106 (11%) |
10-19 Yrs | 2329 (9%) | 16811 (11%) | 49794 (12%) | |
20-29 Yrs | 3978 (15%) | 23589 (15%) | 61562 (14%) | |
30-39 Yrs | 3876 (15%) | 22304 (14%) | 59691 (14%) | |
40-49 Yrs | 3502 (13%) | 19695 (13%) | 54228 (13%) | |
50-59 Yrs | 3022 (11%) | 20429 (13%) | 55404 (13%) | |
60-69 Yrs | 2848 (11%) | 16694 (11%) | 44796 (10%) | |
70+ Yrs | 3369 (13%) | 14453 (9%) | 37779 (9%) | |
Median HH Income | $38,899 | $39,330 | $41,547 | |
Total Household Income | < 24K | 3308 (29%) | 18104 (30%) | 46524 (29%) |
25-49K | 4098 (36%) | 18464 (30%) | 45091 (28%) | |
50-74K | 2022 (17%) | 10457 (17%) | 27488 (17%) | |
75-99K | 784 (6%) | 5615 (9%) | 15759 (9%) | |
100-199K | 964 (8%) | 6246 (10%) | 18882 (11%) | |
200K+ | 178 (1%) | 1192 (1%) | 4656 (2%) | |
Highest Education Level | No Diploma | 3045 | 20956 | 57088 |
Diploma or GED | 5346 | 33309 | 87984 | |
Some College | 5047 | 25373 | 67810 | |
Assoc. Degree | 1135 | 5665 | 17705 | |
Bachelors Degree | 2664 | 13410 | 36432 | |
Higher Degree | 1531 | 6733 | 17650 | |
Total Housing Units | 13,057 | 75,063 | 195,971 | |
--Owner-Occupied | 2,837 | 20,417 | 61,097 | |
--Renter-Occupied | 8,517 | 39,660 | 97,304 | |
Owner-Occupied Values | < 100K | 645 | 3344 | 10491 |
100-199K | 977 | 7766 | 19081 | |
200-299K | 657 | 5817 | 17691 | |
300-399K | 277 | 1713 | 7291 | |
400-499K | 142 | 855 | 3129 | |
500K+ | 140 | 921 | 3414 | |
Total Working Age Population | 21,608 | 124,139 | 332,698 | |
In Work Force | 13,892 | 80,920 | 211,458 | |
Not In Work Force | 7,716 | 43,220 | 121,240 | |
Workforce Employed | 12,840 | 73,952 | 194,610 | |
Workforce Unemployed | 1,038 | 6,942 | 16,695 | |
Civlian Workforce | 13,878 | 80,894 | 211,305 | |
Military Workforce | 14 | 25 | 153 | |
Total Households | 11,354 | 60,078 | 158,401 | |
Family Households | 5,098 | 29,963 | 85,523 | |
Non-Family Households | 6,256 | 30,114 | 72,878 | |
Married Couple | 2,932 | 17,581 | 51,374 | |
Other Family | 2,166 | 12,382 | 34,149 | |
Married w/Child | 967 | 6,168 | 18,740 | |
Single Male w/Child | 336 | 1,672 | 4,352 | |
Single Female w/Child | 507 | 3,902 | 12,375 |
Population Change Last Two Decades - Plus Projection
2000 | % | 2010 | % | 2020 | % | 2030 | |
---|---|---|---|---|---|---|---|
Nevada | 1,998,257 | +35 | 2,700,551 | +17 | 3,149,234 | +10 | 3,460,728 |
Clark County | 1,375,765 | +42 | 1,951,269 | +19 | 2,318,174 | +10 | 2,550,048 |
Nye County | 32,485 | +35 | 43,946 | +11 | 48,864 | +8 | 52,587 |
Total Working Age Population:
Total Households:
Total Working Age Population:
Total Households:
Total Working Age Population:
Total Households: