Retail Space
8 East Lancaster Avenue Ardmore, PA 19003
8 East Lancaster Avenue Ardmore, PA 19003
Details & Description
Property Highlights
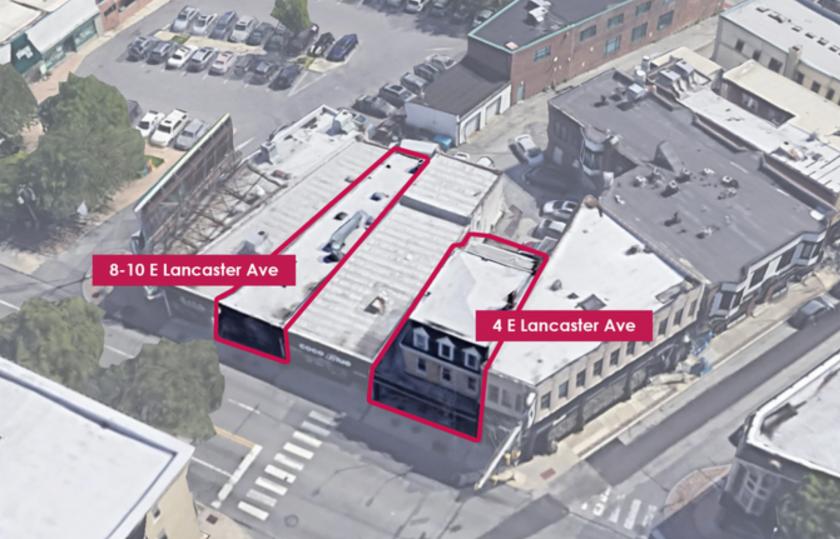
- • 8-10 E Lancaster Avenue - 1,200 SF Available
- • Zoned TC1 - Town Center 1
- • 4 E Lancaster Avenue - 1,200 - 3,500 SF Available
- • Adjacent public parking lot
Listing Agents

Timothy Pennington
O: 215-448-6000
tpennington@binswanger.com
O: 215-448-6000
tpennington@binswanger.com
While we strive to provide the most accurate information, all listing information, and demographic data, is provided by third-parties. As such, MyEListing will not be responsible for the accuracy of the information. It is strongly recommended that you verify all information with the listing agent, and any relevant agencies, prior to making any decisions.


