Office Space
2510 Township Line Road Havertown, PA 19083
2510 Township Line Road Havertown, PA 19083

Details & Description
Property Highlights
- • Three 3 Bathrooms
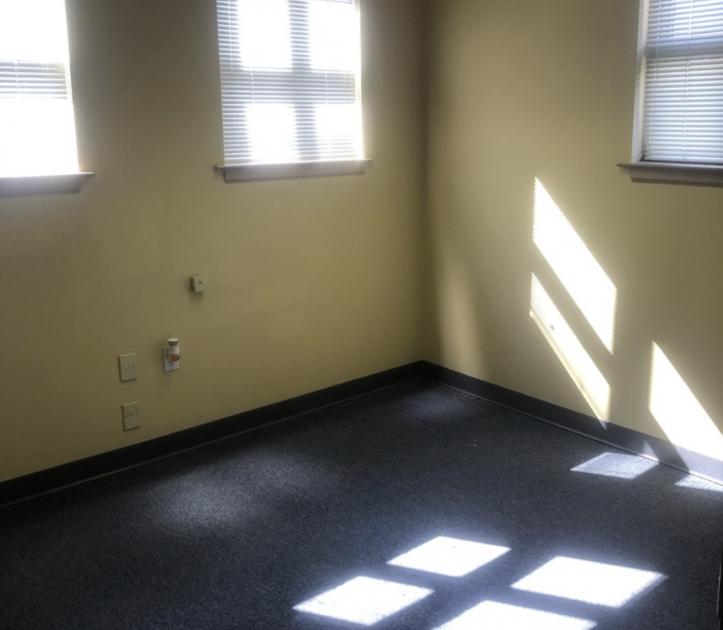
- • Second Floor Office Space
- • Three 3 Offices
Listing Agents

Timothy Pennington
O: 215-448-6000
tpennington@binswanger.com
O: 215-448-6000
tpennington@binswanger.com
While we strive to provide the most accurate information, all listing information, and demographic data, is provided by third-parties. As such, MyEListing will not be responsible for the accuracy of the information. It is strongly recommended that you verify all information with the listing agent, and any relevant agencies, prior to making any decisions.