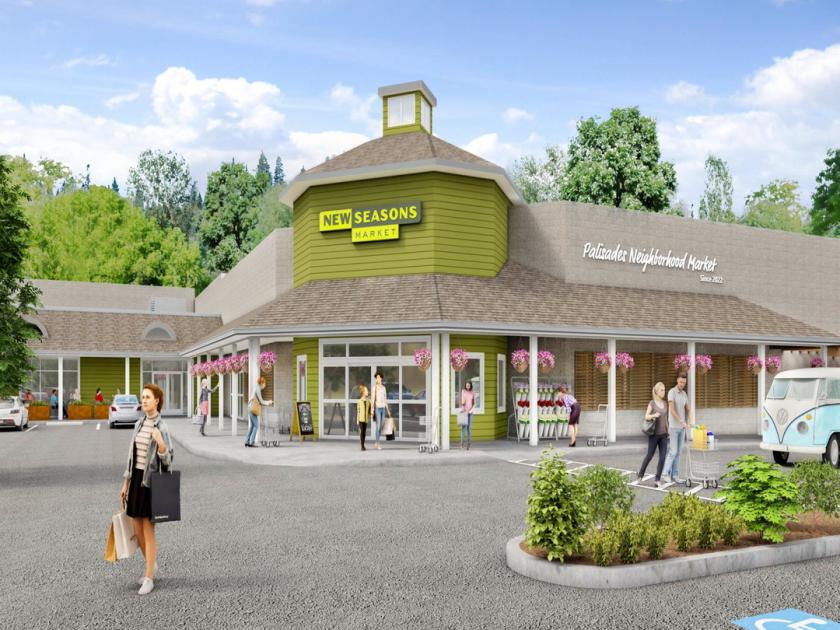
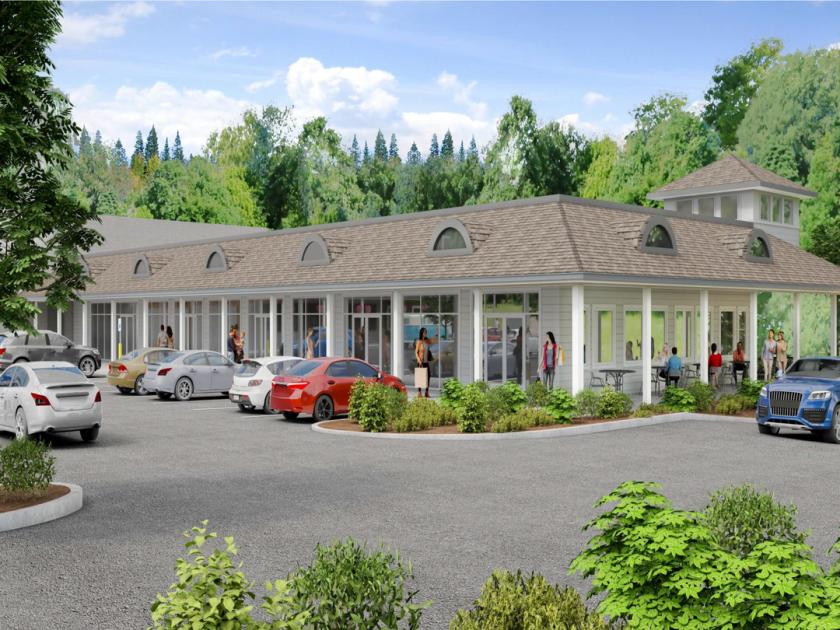
1-Mile | 3-Miles | 5-Miles | ||
---|---|---|---|---|
Total Population | 8,877 | 77,143 | 243,683 | |
Population Median Age | 43 | 43 | 41 | |
Population by Age | 0-9 Yrs | 786 (8%) | 7249 (9%) | 27145 (11%) |
10-19 Yrs | 1381 (15%) | 9852 (12%) | 28633 (11%) | |
20-29 Yrs | 605 (6%) | 7940 (10%) | 27594 (11%) | |
30-39 Yrs | 736 (8%) | 7873 (10%) | 33845 (13%) | |
40-49 Yrs | 1392 (15%) | 10538 (13%) | 32932 (13%) | |
50-59 Yrs | 1536 (17%) | 11842 (15%) | 32828 (13%) | |
60-69 Yrs | 1246 (14%) | 11357 (14%) | 33023 (13%) | |
70+ Yrs | 1195 (13%) | 10492 (13%) | 27685 (11%) | |
Median HH Income | $134,213 | $94,680 | $84,786 | |
Total Household Income | < 24K | 303 (8%) | 3646 (11%) | 13036 (13%) |
25-49K | 412 (11%) | 4822 (15%) | 15879 (15%) | |
50-74K | 259 (7%) | 4573 (14%) | 15646 (15%) | |
75-99K | 387 (10%) | 3808 (11%) | 13436 (13%) | |
100-199K | 1115 (30%) | 8935 (27%) | 27379 (27%) | |
200K+ | 1129 (31%) | 6294 (19%) | 14266 (14%) | |
Highest Education Level | No Diploma | 30 | 2282 | 7869 |
Diploma or GED | 341 | 6581 | 25908 | |
Some College | 921 | 10244 | 36818 | |
Assoc. Degree | 287 | 3117 | 12519 | |
Bachelors Degree | 2649 | 19879 | 55790 | |
Higher Degree | 2132 | 14226 | 36890 | |
Total Housing Units | 3,823 | 33,804 | 104,177 | |
--Owner-Occupied | 2,916 | 23,161 | 66,965 | |
--Renter-Occupied | 689 | 8,917 | 32,677 | |
Owner-Occupied Values | < 100K | 26 | 681 | 1774 |
100-199K | 48 | 899 | 2791 | |
200-299K | 85 | 2363 | 9637 | |
300-399K | 184 | 3593 | 14778 | |
400-499K | 309 | 3121 | 12841 | |
500K+ | 2263 | 12504 | 25144 | |
Total Working Age Population | 7,103 | 63,714 | 198,413 | |
In Work Force | 4,509 | 40,301 | 131,443 | |
Not In Work Force | 2,595 | 23,413 | 66,971 | |
Workforce Employed | 4,374 | 38,604 | 125,327 | |
Workforce Unemployed | 134 | 1,675 | 6,003 | |
Civlian Workforce | 4,509 | 40,279 | 131,331 | |
Military Workforce | 0 | 23 | 112 | |
Total Households | 3,605 | 32,079 | 99,642 | |
Family Households | 2,691 | 20,964 | 62,855 | |
Non-Family Households | 914 | 11,115 | 36,786 | |
Married Couple | 2,328 | 17,715 | 50,838 | |
Other Family | 363 | 3,248 | 12,018 | |
Married w/Child | 983 | 6,997 | 20,021 | |
Single Male w/Child | 64 | 407 | 1,650 | |
Single Female w/Child | 142 | 1,156 | 5,118 |
Population Change Last Two Decades - Plus Projection
2000 | % | 2010 | % | 2020 | % | 2030 | |
---|---|---|---|---|---|---|---|
Oregon | 3,421,399 | +12 | 3,831,074 | +11 | 4,264,810 | +11 | 4,727,438 |
Clackamas County | 338,391 | +11 | 375,992 | +14 | 428,860 | +14 | 490,011 |
Multnomah County | 660,486 | +11 | 735,334 | +12 | 822,675 | +10 | 906,904 |
Washington County | 445,342 | +19 | 529,710 | +17 | 619,337 | +16 | 718,633 |
Total Working Age Population:
Total Households:
Total Working Age Population:
Total Households:
Total Working Age Population:
Total Households: