Industrial Properties
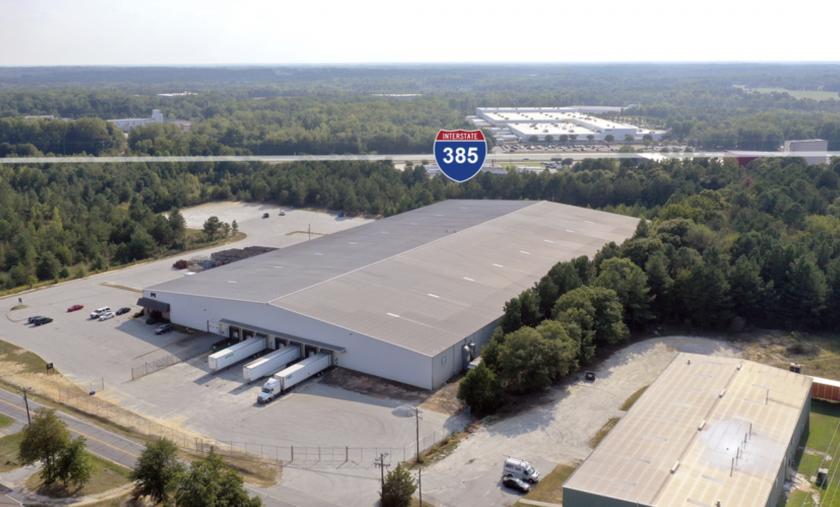
362 North Old Laurens Road Fountain Inn, SC 29644
362 North Old Laurens Road Fountain Inn, SC 29644
Details & Description
Property Highlights
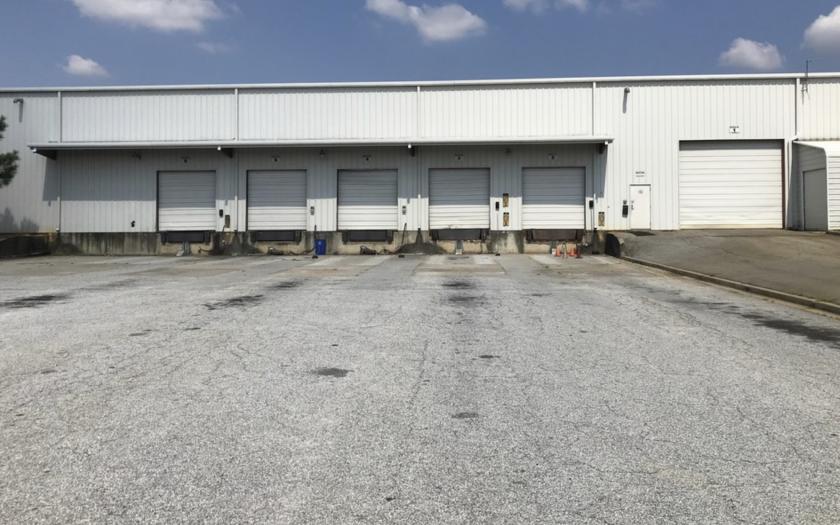
• Five 10 x 10 manual dock high doors with pit levelers, dock locks and a continuous awning. One 14 x 16 manual drive
• 100 wet system, 0.3 GPM2000SF density
Listing Agents

Shaun Kirchin
O: 803-413-7169
skirchin@binswanger.com
O: 803-413-7169
skirchin@binswanger.com
While we strive to provide the most accurate information, all listing information, and demographic data, is provided by third-parties. As such, MyEListing will not be responsible for the accuracy of the information. It is strongly recommended that you verify all information with the listing agent, and any relevant agencies, prior to making any decisions.