Industrial Properties
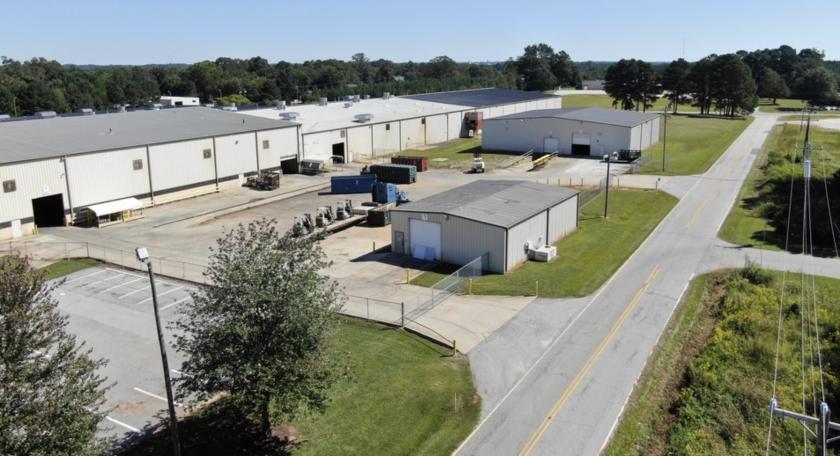
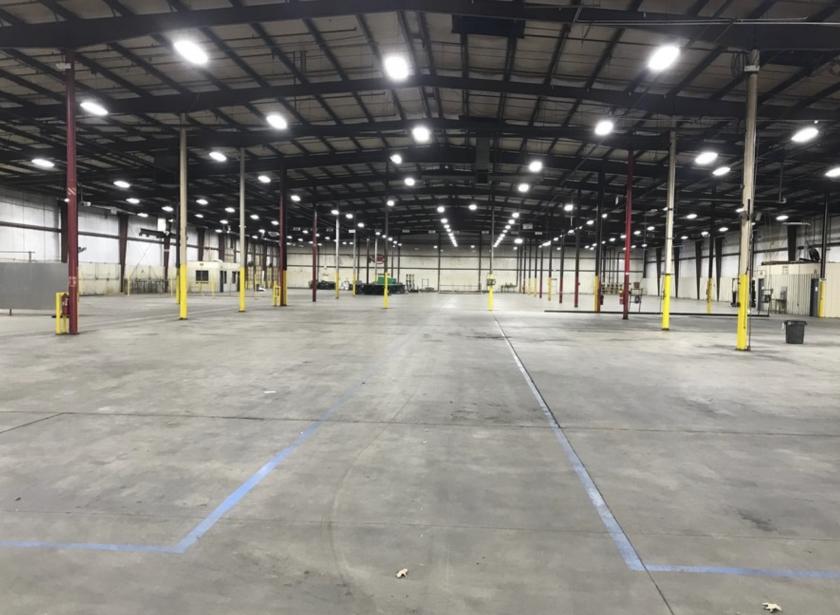
161 Rock Church Road Southeast Greenwood, SC 29649
161 Rock Church Road Southeast Greenwood, SC 29649

Details & Description
Listing Agents

Shaun Kirchin
O: 803-413-7169
skirchin@binswanger.com
O: 803-413-7169
skirchin@binswanger.com
While we strive to provide the most accurate information, all listing information, and demographic data, is provided by third-parties. As such, MyEListing will not be responsible for the accuracy of the information. It is strongly recommended that you verify all information with the listing agent, and any relevant agencies, prior to making any decisions.