Industrial Properties
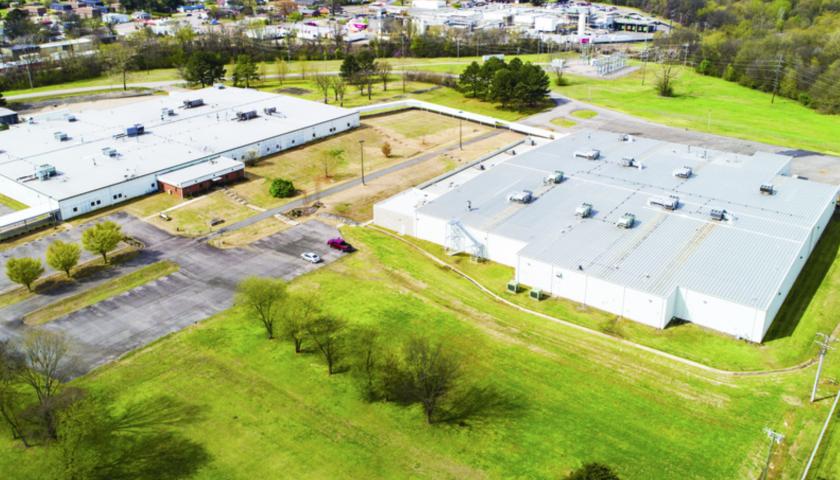
1 R S Boreham Drive Clarksville, AR 72830
1 R S Boreham Drive Clarksville, AR 72830
Details & Description
Listing Agents

Holmes Davis
O: 215-448-6000
hdavis@binswanger.com
O: 215-448-6000
hdavis@binswanger.com
While we strive to provide the most accurate information, all listing information, and demographic data, is provided by third-parties. As such, MyEListing will not be responsible for the accuracy of the information. It is strongly recommended that you verify all information with the listing agent, and any relevant agencies, prior to making any decisions.


