Industrial Properties
1777 Gears Road Houston, TX 77067
1777 Gears Road Houston, TX 77067

Details & Description
Property Highlights
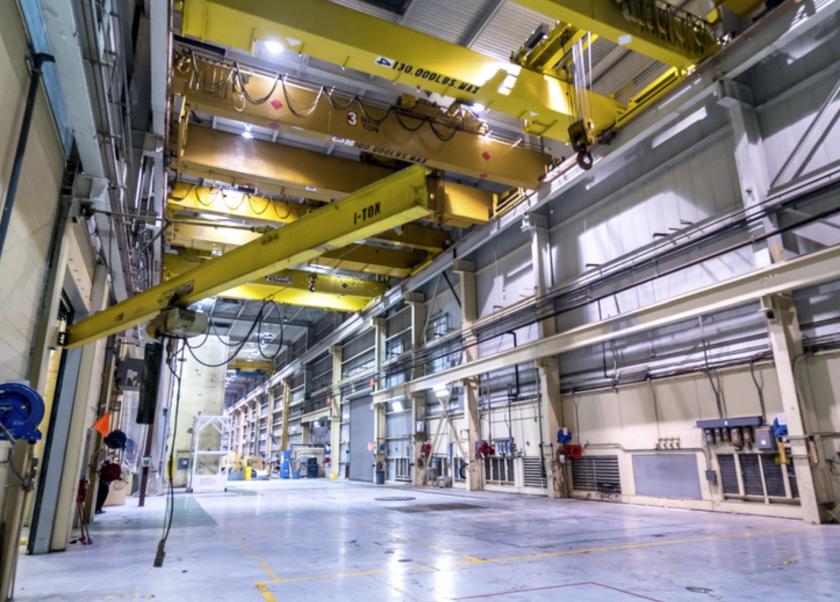
• Heavy Cranes - Jib and Bridge cranes to over 100 tons throughout the facility
• Docks approximately 10 overhead dock doors
Listing Agents

Holmes Davis
O: 215-448-6000
hdavis@binswanger.com
O: 215-448-6000
hdavis@binswanger.com
While we strive to provide the most accurate information, all listing information, and demographic data, is provided by third-parties. As such, MyEListing will not be responsible for the accuracy of the information. It is strongly recommended that you verify all information with the listing agent, and any relevant agencies, prior to making any decisions.