Industrial Properties
2412 U.S. 169 Coffeyville, KS 67337
2412 U.S. 169 Coffeyville, KS 67337
Details & Description
Property Highlights
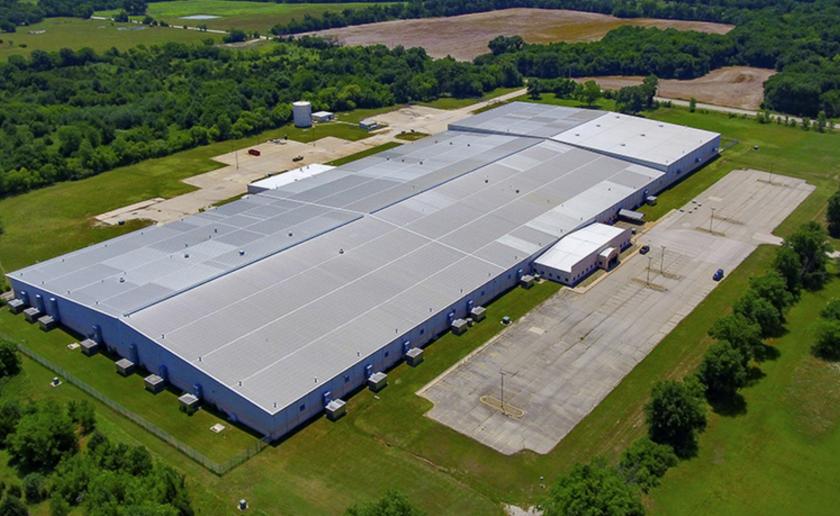
• Ceiling heights ranging from 22 to 364 in the production area and 34 to 385 in the warehouse area
• Circular steel columns spaced 25 x 50 in the production area and 36 x 50 in the warehouse area
Listing Agents

Kipp Collins
O: 972-354-8078
kcollins@paladin-partners.com
O: 972-354-8078
kcollins@paladin-partners.com
While we strive to provide the most accurate information, all listing information, and demographic data, is provided by third-parties. As such, MyEListing will not be responsible for the accuracy of the information. It is strongly recommended that you verify all information with the listing agent, and any relevant agencies, prior to making any decisions.