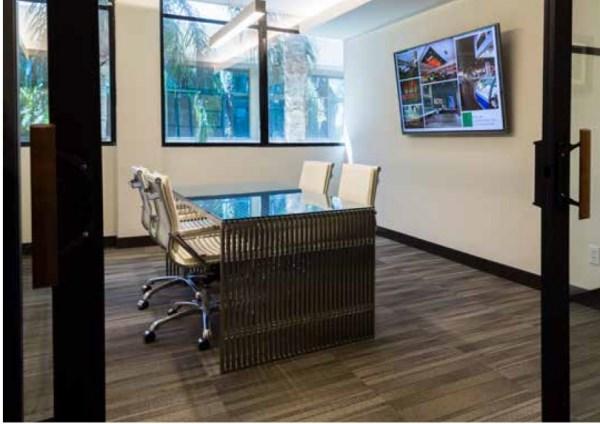
Office Space
1701 West Charleston Boulevard Las Vegas, NV 89102
1701 West Charleston Boulevard Las Vegas, NV 89102
Details & Description
Property Highlights
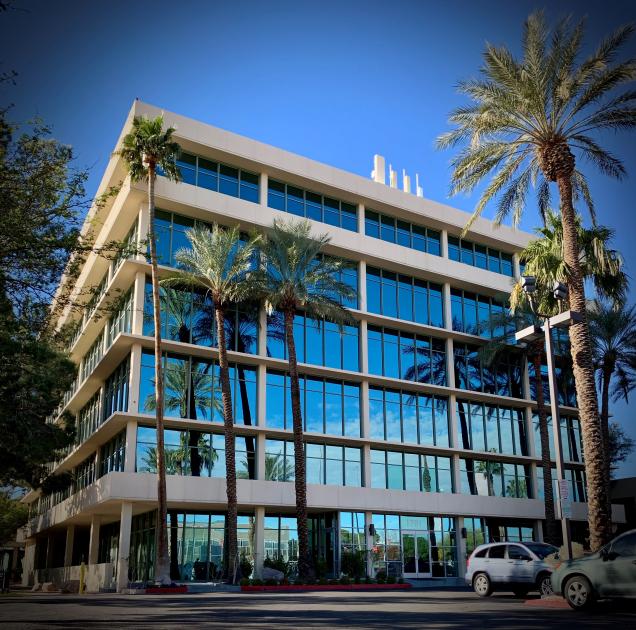
• Less than a mile from UMC, Horizon Specialty Hospital and Valley Hospital Medical Center
• 6 Story professional office building in the heart of Las Vegas Medical District
Listing Agents

David Bauman
O: 702-954-4126
M: 702-460-7013
dbauman@logiccre.com
O: 702-954-4126
M: 702-460-7013
dbauman@logiccre.com
While we strive to provide the most accurate information, all listing information, and demographic data, is provided by third-parties. As such, MyEListing will not be responsible for the accuracy of the information. It is strongly recommended that you verify all information with the listing agent, and any relevant agencies, prior to making any decisions.