Flex-Office-Warehouse
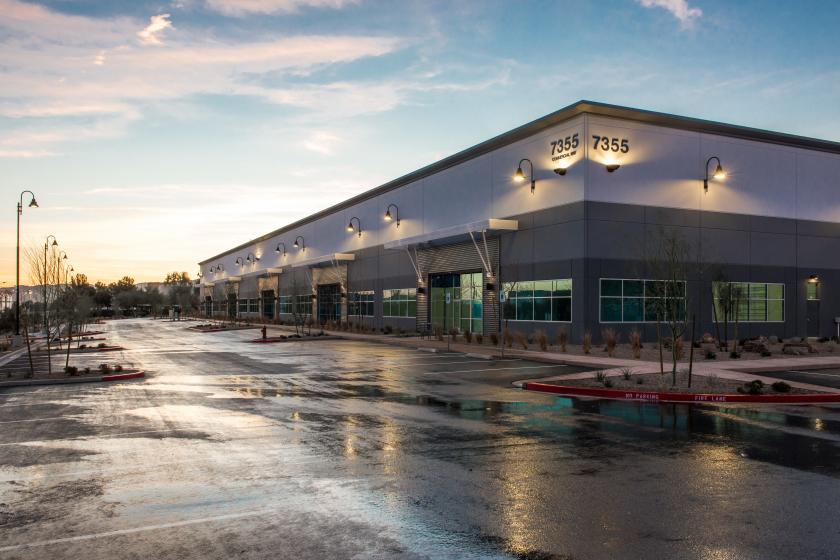
7375 Commercial Way Henderson, NV 89011
7375 Commercial Way Henderson, NV 89011
Details & Description
Property Highlights
- • Unit available 3,632 SF
- • Lease Rate $0.85 SFM
- • CAMs $0.26 SFM
- • Built in 2018
- • Zoned I-G General Industrial
- • CAMs include HVAC maintenance, trash and recycling
Listing Agents

Jarrad Katz
M: 702-610-1002
jkatz@mdlgroup.com
M: 702-610-1002
jkatz@mdlgroup.com
While we strive to provide the most accurate information, all listing information, and demographic data, is provided by third-parties. As such, MyEListing will not be responsible for the accuracy of the information. It is strongly recommended that you verify all information with the listing agent, and any relevant agencies, prior to making any decisions.


