Office Space
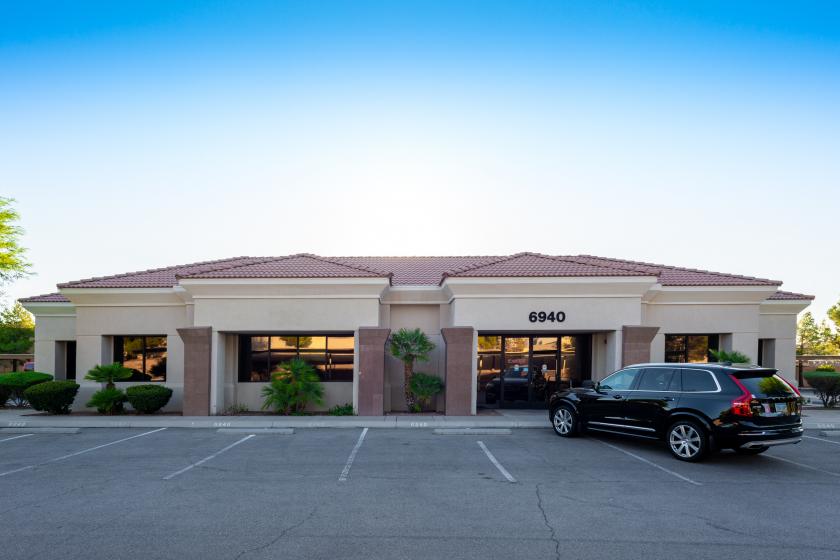
6940 OBannon Drive Las Vegas, NV 89117
6940 OBannon Drive Las Vegas, NV 89117
Details & Description
Property Highlights
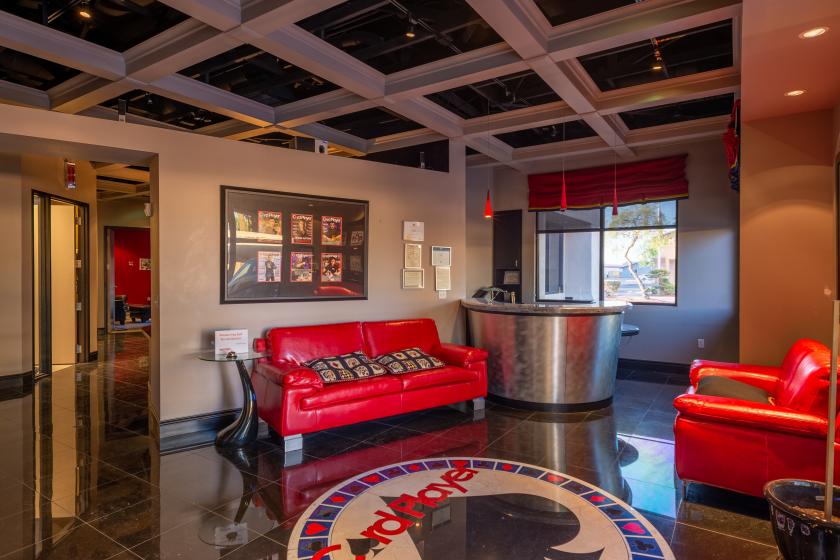
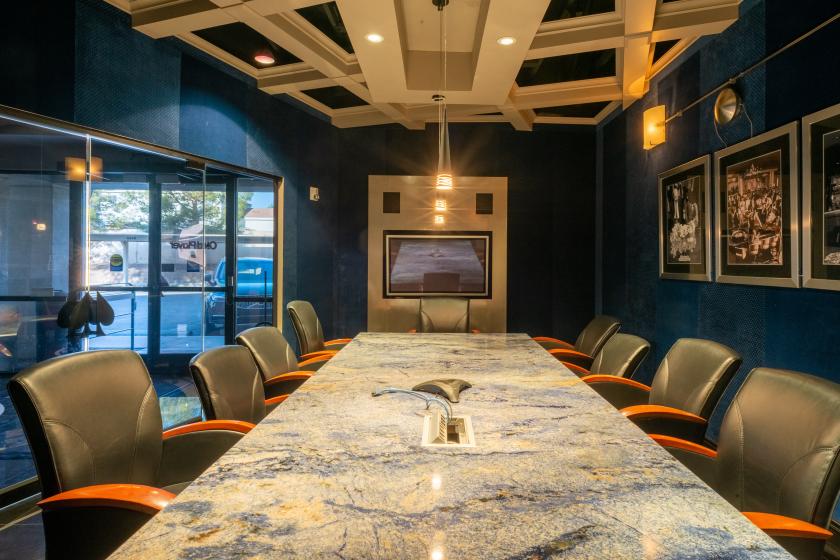
- • Turnkey with high-end modern interior
- • APN 163-03-714-008
- • Lot size 0.59 acres
- • Year built 2002
- • Zoning O Office
- • For Lease $1.15 PSF NNN CAMs $0.31 PSF
Listing Agents

Jarrad Katz
M: 702-610-1002
jkatz@mdlgroup.com
M: 702-610-1002
jkatz@mdlgroup.com
While we strive to provide the most accurate information, all listing information, and demographic data, is provided by third-parties. As such, MyEListing will not be responsible for the accuracy of the information. It is strongly recommended that you verify all information with the listing agent, and any relevant agencies, prior to making any decisions.