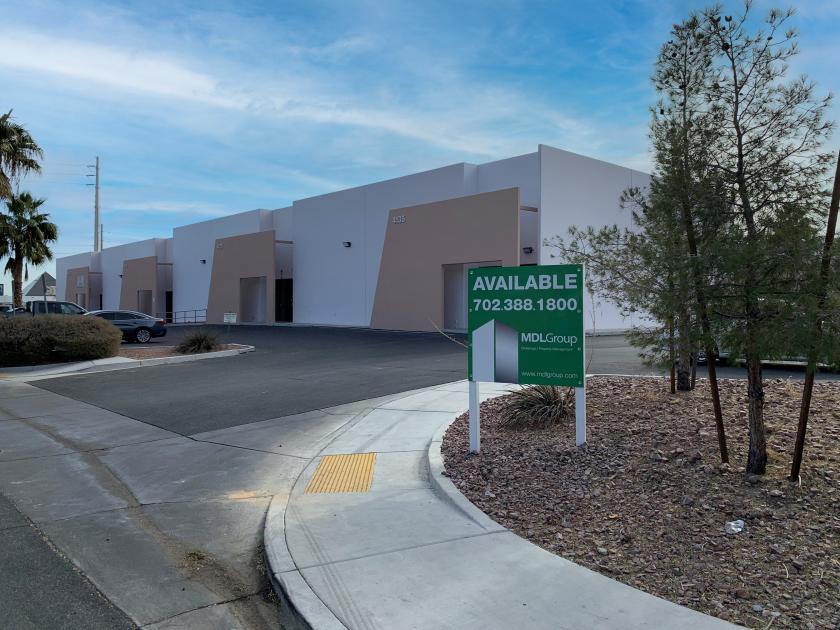
Flex-Office-Warehouse
4155 West Bell Drive Las Vegas, NV 89118
4155 West Bell Drive Las Vegas, NV 89118
Details & Description
Property Highlights
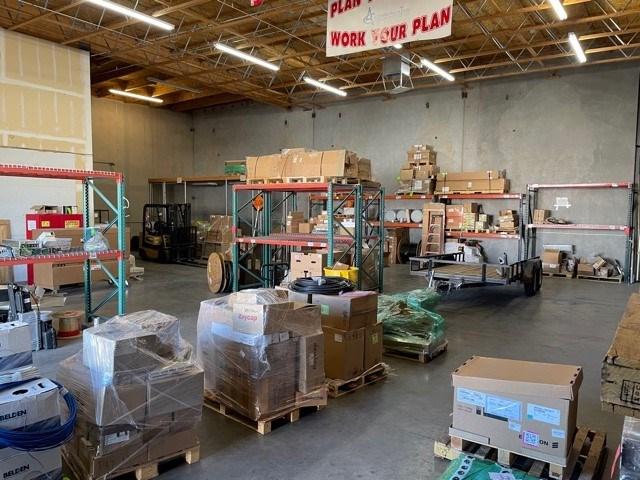
- • 3,987 SF Office Warehouse For Sale
- • APN 162-30-514-004
- • Year built 2005
- • Zoning M-1 Light Industrial
- • Main panel 225A, 3-phase 277480V
- • Sub panel 125A, single phase 120208V
Listing Agents

Jarrad Katz
M: 702-610-1002
jkatz@mdlgroup.com
M: 702-610-1002
jkatz@mdlgroup.com
While we strive to provide the most accurate information, all listing information, and demographic data, is provided by third-parties. As such, MyEListing will not be responsible for the accuracy of the information. It is strongly recommended that you verify all information with the listing agent, and any relevant agencies, prior to making any decisions.