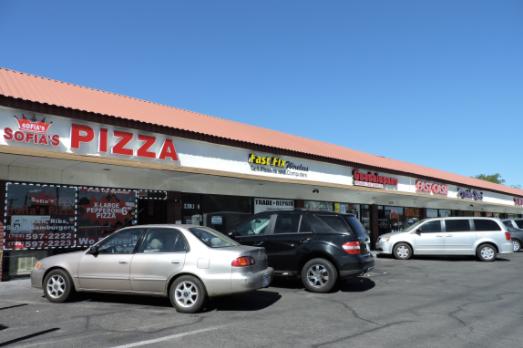
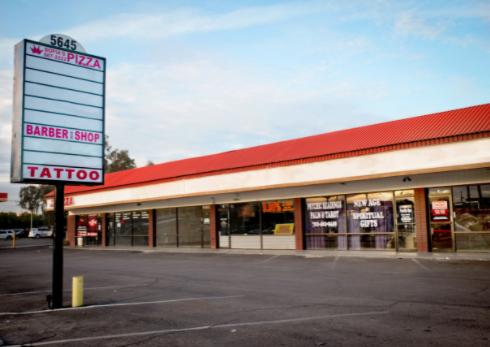
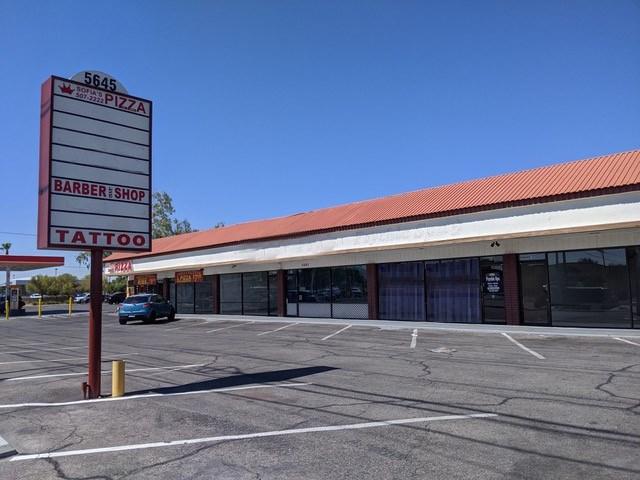
1-Mile | 3-Miles | 5-Miles | ||
---|---|---|---|---|
Total Population | 13,473 | 132,946 | 381,399 | |
Population Median Age | 41 | 39 | 39 | |
Population by Age | 0-9 Yrs | 1340 (9%) | 14230 (10%) | 41774 (10%) |
10-19 Yrs | 1505 (11%) | 14691 (11%) | 43801 (11%) | |
20-29 Yrs | 1607 (11%) | 21114 (15%) | 55702 (14%) | |
30-39 Yrs | 1950 (14%) | 19984 (15%) | 54582 (14%) | |
40-49 Yrs | 1868 (13%) | 17020 (12%) | 50796 (13%) | |
50-59 Yrs | 1765 (13%) | 17772 (13%) | 53185 (13%) | |
60-69 Yrs | 1977 (14%) | 15295 (11%) | 43619 (11%) | |
70+ Yrs | 1461 (10%) | 12840 (9%) | 37940 (9%) | |
Median HH Income | $44,559 | $44,260 | $48,088 | |
Total Household Income | < 24K | 1376 (25%) | 13675 (25%) | 37025 (24%) |
25-49K | 1640 (30%) | 15864 (29%) | 40766 (27%) | |
50-74K | 1074 (19%) | 9233 (17%) | 27476 (18%) | |
75-99K | 603 (11%) | 5810 (10%) | 17027 (11%) | |
100-199K | 601 (11%) | 7024 (13%) | 22539 (14%) | |
200K+ | 85 (1%) | 1545 (2%) | 5785 (3%) | |
Highest Education Level | No Diploma | 1717 | 14386 | 42462 |
Diploma or GED | 3065 | 28317 | 80236 | |
Some College | 2356 | 24801 | 67776 | |
Assoc. Degree | 657 | 6201 | 18339 | |
Bachelors Degree | 1526 | 13501 | 40397 | |
Higher Degree | 599 | 7043 | 20936 | |
Total Housing Units | 6,010 | 62,113 | 186,037 | |
--Owner-Occupied | 2,112 | 19,271 | 65,382 | |
--Renter-Occupied | 3,267 | 33,881 | 85,238 | |
Owner-Occupied Values | < 100K | 332 | 1815 | 8707 |
100-199K | 784 | 5841 | 16951 | |
200-299K | 556 | 6316 | 20301 | |
300-399K | 250 | 2811 | 10771 | |
400-499K | 83 | 1219 | 4240 | |
500K+ | 107 | 1268 | 4411 | |
Total Working Age Population | 11,353 | 110,461 | 312,981 | |
In Work Force | 7,279 | 72,697 | 204,195 | |
Not In Work Force | 4,075 | 37,764 | 108,786 | |
Workforce Employed | 6,668 | 67,455 | 188,590 | |
Workforce Unemployed | 611 | 5,199 | 15,358 | |
Civlian Workforce | 7,279 | 72,654 | 203,949 | |
Military Workforce | 0 | 43 | 247 | |
Total Households | 5,378 | 53,151 | 150,619 | |
Family Households | 2,749 | 27,418 | 82,984 | |
Non-Family Households | 2,630 | 25,734 | 67,635 | |
Married Couple | 1,696 | 17,025 | 52,944 | |
Other Family | 1,053 | 10,393 | 30,040 | |
Married w/Child | 664 | 6,141 | 18,381 | |
Single Male w/Child | 176 | 1,279 | 3,841 | |
Single Female w/Child | 328 | 3,152 | 10,174 |
Population Change Last Two Decades - Plus Projection
2000 | % | 2010 | % | 2020 | % | 2030 | |
---|---|---|---|---|---|---|---|
Nevada | 1,998,257 | +35 | 2,700,551 | +17 | 3,149,234 | +10 | 3,460,728 |
Clark County | 1,375,765 | +42 | 1,951,269 | +19 | 2,318,174 | +10 | 2,550,048 |
Nye County | 32,485 | +35 | 43,946 | +11 | 48,864 | +8 | 52,587 |
Total Working Age Population:
Total Households:
Total Working Age Population:
Total Households:
Total Working Age Population:
Total Households: