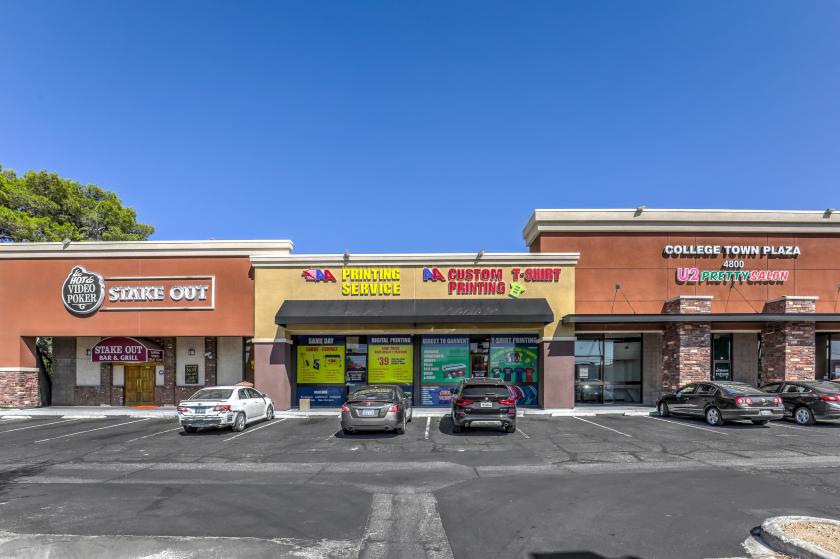
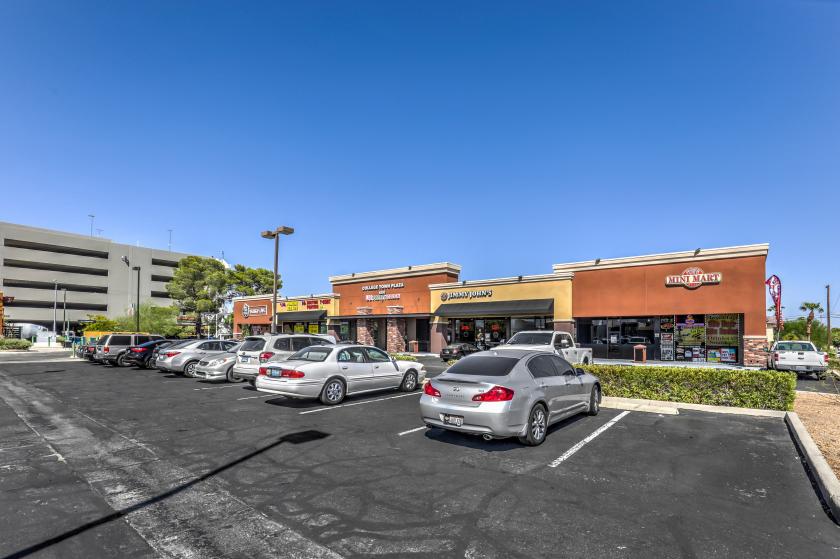
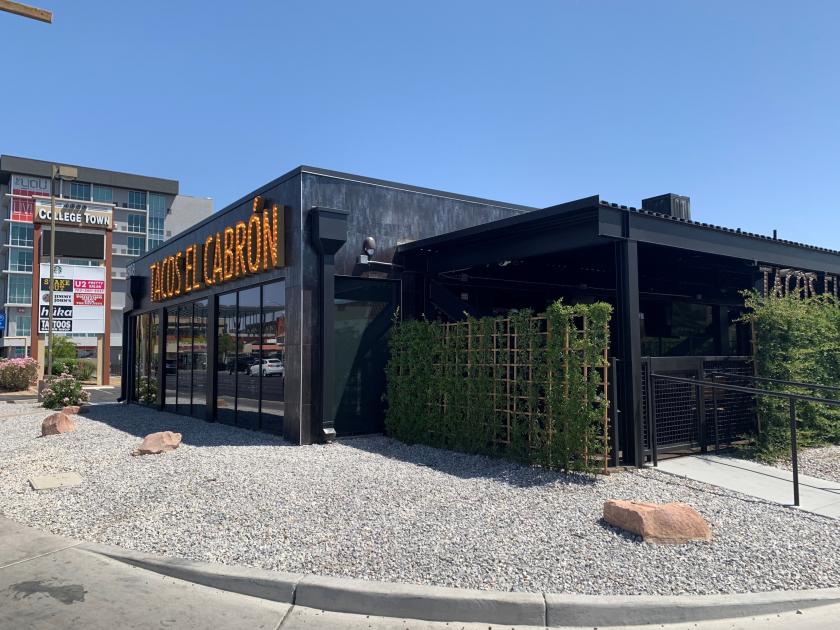
1-Mile | 3-Miles | 5-Miles | ||
---|---|---|---|---|
Total Population | 30,475 | 122,190 | 410,786 | |
Population Median Age | 36 | 39 | 39 | |
Population by Age | 0-9 Yrs | 3420 (11%) | 13011 (10%) | 47959 (11%) |
10-19 Yrs | 3951 (12%) | 13018 (10%) | 47428 (11%) | |
20-29 Yrs | 5297 (17%) | 19743 (16%) | 62523 (15%) | |
30-39 Yrs | 5355 (17%) | 18514 (15%) | 60244 (14%) | |
40-49 Yrs | 4060 (13%) | 15863 (12%) | 54402 (13%) | |
50-59 Yrs | 3549 (11%) | 16625 (13%) | 55105 (13%) | |
60-69 Yrs | 2843 (9%) | 13696 (11%) | 45014 (10%) | |
70+ Yrs | 2000 (6%) | 11719 (9%) | 38111 (9%) | |
Median HH Income | $33,603 | $39,237 | $41,459 | |
Total Household Income | < 24K | 4274 (34%) | 15384 (30%) | 46456 (28%) |
25-49K | 4564 (36%) | 15593 (30%) | 47503 (29%) | |
50-74K | 1975 (15%) | 8451 (16%) | 27490 (17%) | |
75-99K | 839 (6%) | 4791 (9%) | 16108 (9%) | |
100-199K | 777 (6%) | 5292 (10%) | 18964 (11%) | |
200K+ | 95 (0%) | 1237 (2%) | 4800 (2%) | |
Highest Education Level | No Diploma | 4231 | 16167 | 54866 |
Diploma or GED | 6245 | 26080 | 88308 | |
Some College | 4812 | 21496 | 69393 | |
Assoc. Degree | 1060 | 4782 | 18023 | |
Bachelors Degree | 2904 | 11766 | 37517 | |
Higher Degree | 1320 | 6092 | 18196 | |
Total Housing Units | 14,266 | 69,964 | 201,094 | |
--Owner-Occupied | 1,791 | 15,285 | 58,064 | |
--Renter-Occupied | 10,732 | 35,462 | 103,257 | |
Owner-Occupied Values | < 100K | 469 | 2076 | 10451 |
100-199K | 673 | 5430 | 17214 | |
200-299K | 395 | 4343 | 15873 | |
300-399K | 187 | 1540 | 7539 | |
400-499K | 30 | 823 | 3254 | |
500K+ | 37 | 1073 | 3734 | |
Total Working Age Population | 25,206 | 101,687 | 333,430 | |
In Work Force | 16,973 | 66,801 | 213,889 | |
Not In Work Force | 8,232 | 34,886 | 119,541 | |
Workforce Employed | 15,339 | 61,137 | 196,768 | |
Workforce Unemployed | 1,618 | 5,621 | 16,909 | |
Civlian Workforce | 16,958 | 66,758 | 213,677 | |
Military Workforce | 16 | 44 | 212 | |
Total Households | 12,523 | 50,748 | 161,321 | |
Family Households | 5,523 | 24,059 | 85,402 | |
Non-Family Households | 7,000 | 26,689 | 75,919 | |
Married Couple | 2,776 | 13,832 | 50,749 | |
Other Family | 2,747 | 10,227 | 34,653 | |
Married w/Child | 1,144 | 4,637 | 18,302 | |
Single Male w/Child | 455 | 1,455 | 4,372 | |
Single Female w/Child | 933 | 3,233 | 12,503 |
Population Change Last Two Decades - Plus Projection
2000 | % | 2010 | % | 2020 | % | 2030 | |
---|---|---|---|---|---|---|---|
Nevada | 1,998,257 | +35 | 2,700,551 | +17 | 3,149,234 | +10 | 3,460,728 |
Clark County | 1,375,765 | +42 | 1,951,269 | +19 | 2,318,174 | +10 | 2,550,048 |
Nye County | 32,485 | +35 | 43,946 | +11 | 48,864 | +8 | 52,587 |
Total Working Age Population:
Total Households:
Total Working Age Population:
Total Households:
Total Working Age Population:
Total Households: