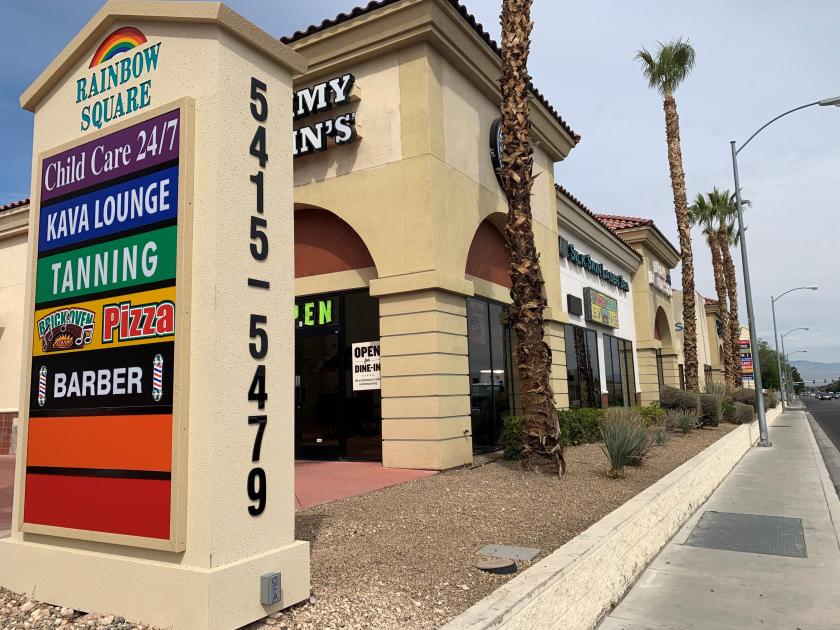
1-Mile | 3-Miles | 5-Miles | ||
---|---|---|---|---|
Total Population | 15,168 | 138,585 | 352,652 | |
Population Median Age | 41 | 39 | 38 | |
Population by Age | 0-9 Yrs | 1463 (9%) | 15020 (10%) | 42305 (11%) |
10-19 Yrs | 1289 (8%) | 14621 (10%) | 38819 (11%) | |
20-29 Yrs | 2543 (16%) | 22036 (15%) | 52791 (14%) | |
30-39 Yrs | 2312 (15%) | 23578 (17%) | 57046 (16%) | |
40-49 Yrs | 1659 (10%) | 17424 (12%) | 49795 (14%) | |
50-59 Yrs | 2558 (16%) | 18834 (13%) | 44724 (12%) | |
60-69 Yrs | 1587 (10%) | 14094 (10%) | 36690 (10%) | |
70+ Yrs | 1757 (11%) | 12979 (9%) | 30482 (8%) | |
Median HH Income | $53,264 | $56,253 | $58,530 | |
Total Household Income | < 24K | 1171 (19%) | 8619 (16%) | 22919 (17%) |
25-49K | 1589 (27%) | 13990 (27%) | 33301 (25%) | |
50-74K | 1186 (20%) | 11007 (21%) | 25872 (19%) | |
75-99K | 666 (11%) | 7080 (13%) | 18135 (13%) | |
100-199K | 982 (16%) | 8721 (17%) | 24316 (18%) | |
200K+ | 270 (4%) | 1871 (3%) | 6856 (5%) | |
Highest Education Level | No Diploma | 1030 | 12521 | 30955 |
Diploma or GED | 3207 | 29359 | 71691 | |
Some College | 3165 | 26265 | 62721 | |
Assoc. Degree | 1100 | 8717 | 20339 | |
Bachelors Degree | 2060 | 16694 | 44170 | |
Higher Degree | 902 | 6301 | 19585 | |
Total Housing Units | 6,787 | 60,628 | 159,947 | |
--Owner-Occupied | 2,813 | 23,303 | 59,472 | |
--Renter-Occupied | 3,052 | 27,986 | 71,927 | |
Owner-Occupied Values | < 100K | 208 | 2711 | 4497 |
100-199K | 735 | 5983 | 11042 | |
200-299K | 941 | 8003 | 17869 | |
300-399K | 458 | 3480 | 13236 | |
400-499K | 185 | 1446 | 5877 | |
500K+ | 286 | 1680 | 6950 | |
Total Working Age Population | 12,972 | 114,332 | 285,552 | |
In Work Force | 8,659 | 78,093 | 195,822 | |
Not In Work Force | 4,313 | 36,239 | 89,729 | |
Workforce Employed | 8,197 | 73,918 | 185,649 | |
Workforce Unemployed | 462 | 4,132 | 9,992 | |
Civlian Workforce | 8,659 | 78,050 | 195,641 | |
Military Workforce | 0 | 43 | 182 | |
Total Households | 5,864 | 51,289 | 131,399 | |
Family Households | 3,341 | 31,086 | 80,235 | |
Non-Family Households | 2,524 | 20,203 | 51,164 | |
Married Couple | 2,320 | 19,984 | 51,745 | |
Other Family | 1,021 | 11,102 | 28,490 | |
Married w/Child | 752 | 7,697 | 20,157 | |
Single Male w/Child | 120 | 1,674 | 4,225 | |
Single Female w/Child | 298 | 3,277 | 9,353 |
Population Change Last Two Decades - Plus Projection
2000 | % | 2010 | % | 2020 | % | 2030 | |
---|---|---|---|---|---|---|---|
Nevada | 1,998,257 | +35 | 2,700,551 | +17 | 3,149,234 | +10 | 3,460,728 |
Clark County | 1,375,765 | +42 | 1,951,269 | +19 | 2,318,174 | +10 | 2,550,048 |
Nye County | 32,485 | +35 | 43,946 | +11 | 48,864 | +8 | 52,587 |
Total Working Age Population:
Total Households:
Total Working Age Population:
Total Households:
Total Working Age Population:
Total Households: