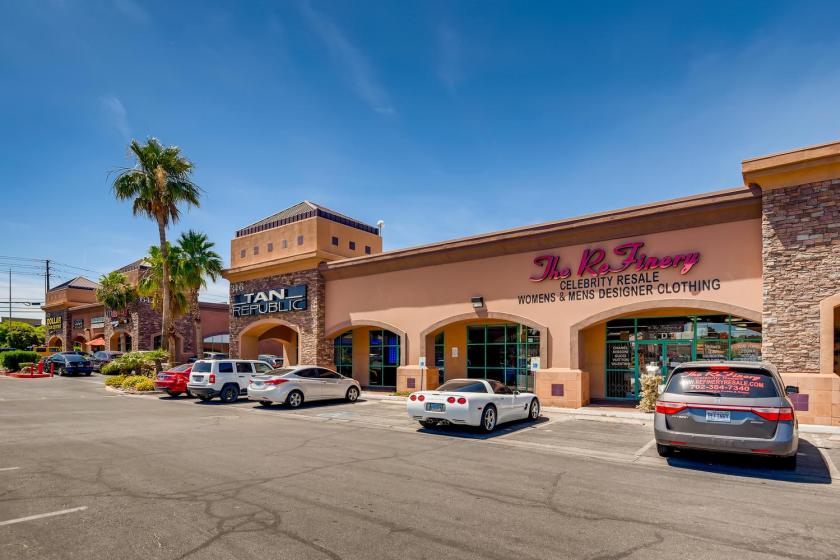
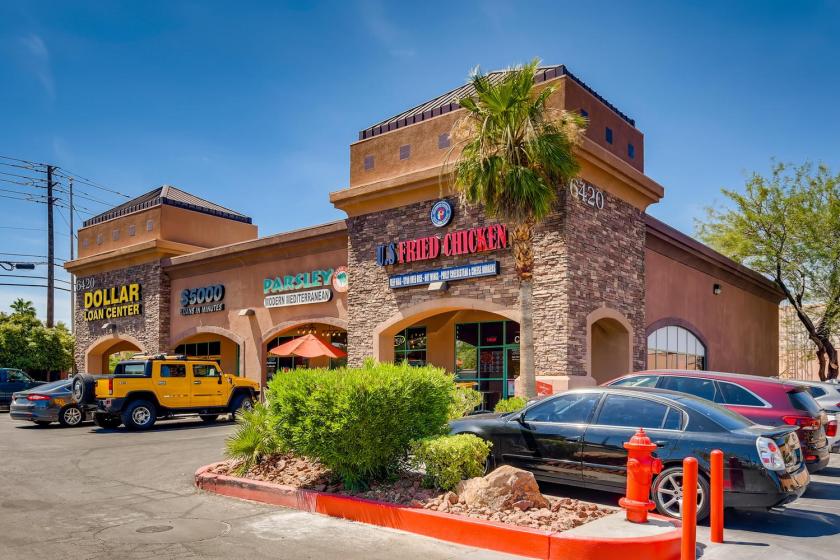
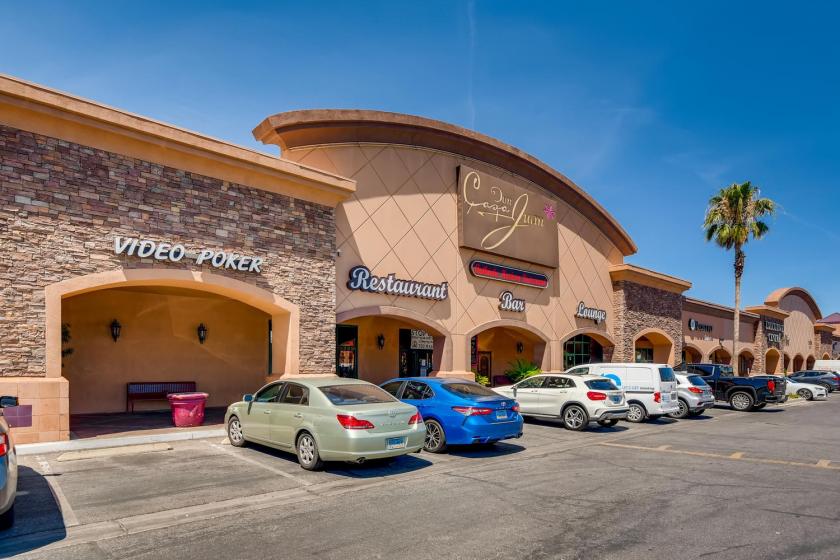
1-Mile | 3-Miles | 5-Miles | ||
---|---|---|---|---|
Total Population | 7,288 | 148,136 | 395,848 | |
Population Median Age | 41 | 40 | 39 | |
Population by Age | 0-9 Yrs | 750 (10%) | 16638 (11%) | 42761 (10%) |
10-19 Yrs | 851 (11%) | 17593 (11%) | 46542 (11%) | |
20-29 Yrs | 1018 (13%) | 20051 (13%) | 57495 (14%) | |
30-39 Yrs | 983 (13%) | 21304 (14%) | 57147 (14%) | |
40-49 Yrs | 809 (11%) | 19285 (13%) | 53140 (13%) | |
50-59 Yrs | 936 (12%) | 20628 (13%) | 53797 (13%) | |
60-69 Yrs | 1112 (15%) | 17303 (11%) | 44871 (11%) | |
70+ Yrs | 829 (11%) | 15334 (10%) | 40095 (10%) | |
Median HH Income | $54,491 | $56,880 | $54,155 | |
Total Household Income | < 24K | 574 (19%) | 10636 (18%) | 32663 (21%) |
25-49K | 833 (27%) | 14803 (25%) | 39473 (25%) | |
50-74K | 464 (15%) | 11086 (19%) | 29237 (18%) | |
75-99K | 376 (12%) | 7511 (13%) | 19166 (12%) | |
100-199K | 502 (16%) | 10357 (18%) | 26957 (17%) | |
200K+ | 234 (7%) | 2859 (4%) | 7021 (4%) | |
Highest Education Level | No Diploma | 393 | 12067 | 36136 |
Diploma or GED | 1510 | 30322 | 80960 | |
Some College | 1413 | 27627 | 72164 | |
Assoc. Degree | 334 | 7869 | 20378 | |
Bachelors Degree | 919 | 17396 | 46380 | |
Higher Degree | 627 | 9874 | 24620 | |
Total Housing Units | 3,241 | 63,862 | 182,404 | |
--Owner-Occupied | 1,404 | 28,068 | 72,620 | |
--Renter-Occupied | 1,579 | 29,184 | 81,898 | |
Owner-Occupied Values | < 100K | 100 | 1994 | 7503 |
100-199K | 226 | 6548 | 17002 | |
200-299K | 372 | 9408 | 24035 | |
300-399K | 255 | 5787 | 13433 | |
400-499K | 115 | 2217 | 5808 | |
500K+ | 337 | 2114 | 4838 | |
Total Working Age Population | 6,051 | 121,086 | 325,281 | |
In Work Force | 3,634 | 80,343 | 214,606 | |
Not In Work Force | 2,417 | 40,743 | 110,675 | |
Workforce Employed | 3,486 | 75,225 | 199,291 | |
Workforce Unemployed | 148 | 4,998 | 15,011 | |
Civlian Workforce | 3,634 | 80,223 | 214,302 | |
Military Workforce | 0 | 120 | 304 | |
Total Households | 2,984 | 57,252 | 154,518 | |
Family Households | 1,548 | 33,464 | 88,547 | |
Non-Family Households | 1,435 | 23,788 | 65,971 | |
Married Couple | 1,076 | 22,475 | 58,679 | |
Other Family | 472 | 10,989 | 29,869 | |
Married w/Child | 426 | 8,288 | 21,126 | |
Single Male w/Child | 83 | 1,514 | 3,963 | |
Single Female w/Child | 130 | 3,522 | 9,472 |
Population Change Last Two Decades - Plus Projection
2000 | % | 2010 | % | 2020 | % | 2030 | |
---|---|---|---|---|---|---|---|
Nevada | 1,998,257 | +35 | 2,700,551 | +17 | 3,149,234 | +10 | 3,460,728 |
Clark County | 1,375,765 | +42 | 1,951,269 | +19 | 2,318,174 | +10 | 2,550,048 |
Nye County | 32,485 | +35 | 43,946 | +11 | 48,864 | +8 | 52,587 |
Total Working Age Population:
Total Households:
Total Working Age Population:
Total Households:
Total Working Age Population:
Total Households: