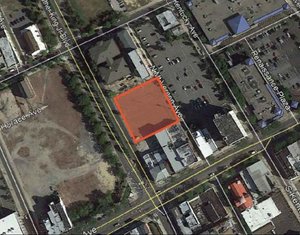
1-Mile | 3-Miles | 5-Miles | ||
---|---|---|---|---|
Total Population | 2,334 | 17,660 | 32,170 | |
Population Median Age | 36 | 36 | 37 | |
Population by Age | 0-9 Yrs | 348 (14%) | 2586 (14%) | 4542 (14%) |
10-19 Yrs | 409 (17%) | 2944 (16%) | 5081 (15%) | |
20-29 Yrs | 177 (7%) | 1405 (7%) | 2838 (8%) | |
30-39 Yrs | 270 (11%) | 2324 (13%) | 4139 (12%) | |
40-49 Yrs | 408 (17%) | 2915 (16%) | 4999 (15%) | |
50-59 Yrs | 355 (15%) | 2669 (15%) | 4984 (15%) | |
60-69 Yrs | 233 (9%) | 1778 (10%) | 3409 (10%) | |
70+ Yrs | 134 (5%) | 1039 (5%) | 2178 (6%) | |
Median HH Income | $147,234 | $127,069 | $121,936 | |
Total Household Income | < 24K | 34 (4%) | 387 (6%) | 769 (7%) |
25-49K | 36 (4%) | 409 (7%) | 888 (8%) | |
50-74K | 60 (8%) | 580 (10%) | 1151 (10%) | |
75-99K | 96 (13%) | 794 (13%) | 1288 (12%) | |
100-199K | 264 (36%) | 2210 (38%) | 4242 (40%) | |
200K+ | 237 (32%) | 1298 (22%) | 2235 (21%) | |
Highest Education Level | No Diploma | 70 | 750 | 1221 |
Diploma or GED | 286 | 2364 | 4564 | |
Some College | 202 | 1814 | 3494 | |
Assoc. Degree | 128 | 1011 | 1866 | |
Bachelors Degree | 487 | 3453 | 5992 | |
Higher Degree | 333 | 2098 | 3893 | |
Total Housing Units | 779 | 6,108 | 11,455 | |
--Owner-Occupied | 603 | 4,740 | 8,939 | |
--Renter-Occupied | 123 | 936 | 1,633 | |
Owner-Occupied Values | < 100K | 8 | 69 | 165 |
100-199K | 35 | 763 | 1513 | |
200-299K | 129 | 1322 | 2577 | |
300-399K | 275 | 1665 | 2825 | |
400-499K | 118 | 683 | 1198 | |
500K+ | 39 | 237 | 662 | |
Total Working Age Population | 1,735 | 13,178 | 24,220 | |
In Work Force | 1,242 | 9,504 | 17,500 | |
Not In Work Force | 493 | 3,674 | 6,720 | |
Workforce Employed | 1,208 | 9,204 | 16,945 | |
Workforce Unemployed | 35 | 293 | 535 | |
Civlian Workforce | 1,242 | 9,497 | 17,480 | |
Military Workforce | 0 | 7 | 20 | |
Total Households | 727 | 5,677 | 10,573 | |
Family Households | 606 | 4,570 | 8,344 | |
Non-Family Households | 121 | 1,107 | 2,228 | |
Married Couple | 525 | 3,823 | 7,012 | |
Other Family | 80 | 747 | 1,332 | |
Married w/Child | 268 | 1,934 | 3,458 | |
Single Male w/Child | 31 | 188 | 292 | |
Single Female w/Child | 28 | 301 | 528 |
Population Change Last Two Decades - Plus Projection
2000 | % | 2010 | % | 2020 | % | 2030 | |
---|---|---|---|---|---|---|---|
Delaware | 783,600 | +15 | 897,934 | +10 | 989,803 | +6 | 1,044,965 |
New Castle County | 500,265 | +8 | 538,479 | +6 | 571,165 | +4 | 596,221 |
New Jersey | 8,414,350 | +4 | 8,791,894 | +4 | 9,132,700 | +4 | 9,530,900 |
Gloucester County | 254,673 | +13 | 288,288 | +1 | 292,000 | +5 | 305,800 |
Salem County | 64,285 | +3 | 66,083 | -5 | 63,000 | -3 | 61,000 |
Pennsylvania | 12,281,054 | +3 | 12,702,379 | +4 | 13,230,170 | +4 | 13,759,594 |
Chester County | 433,501 | +15 | 498,886 | +7 | 533,837 | +7 | 573,576 |
Total Working Age Population:
Total Households:
Total Working Age Population:
Total Households:
Total Working Age Population:
Total Households: