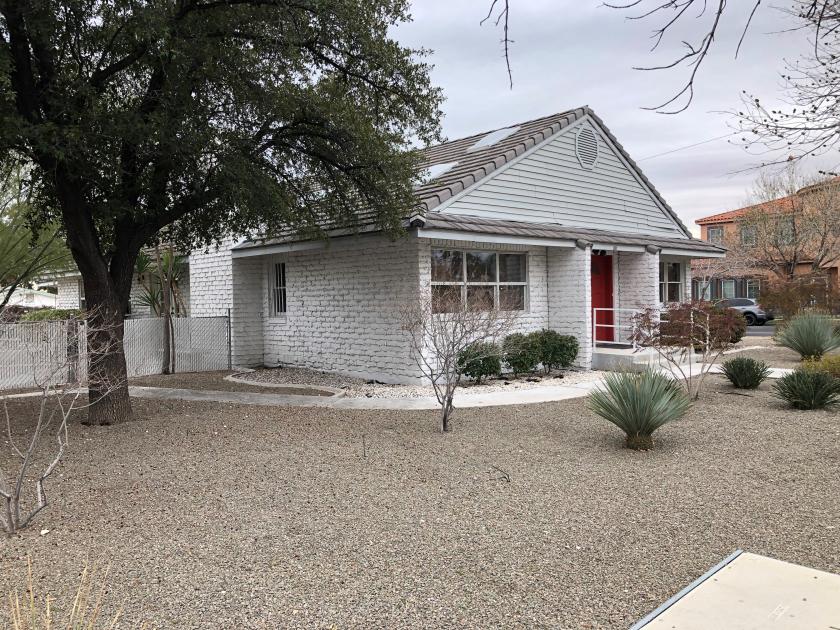
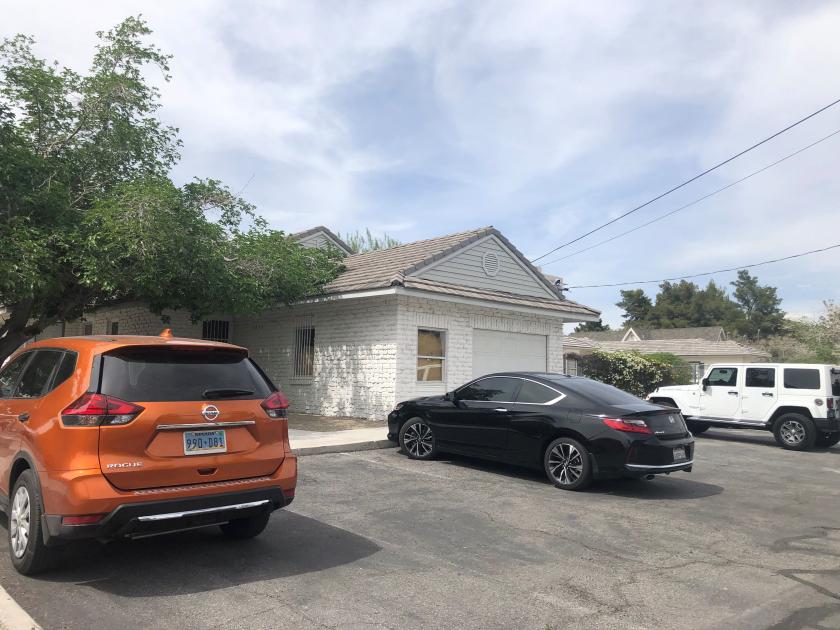
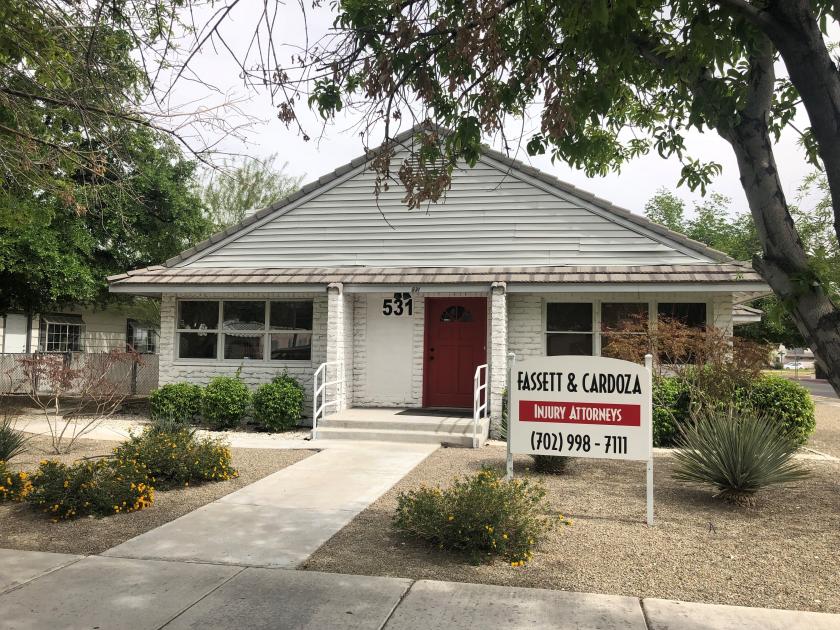
1-Mile | 3-Miles | 5-Miles | ||
---|---|---|---|---|
Total Population | 18,305 | 170,090 | 507,663 | |
Population Median Age | 41 | 37 | 36 | |
Population by Age | 0-9 Yrs | 1455 (7%) | 23047 (13%) | 71103 (14%) |
10-19 Yrs | 1345 (7%) | 22226 (13%) | 71153 (14%) | |
20-29 Yrs | 2882 (15%) | 25422 (14%) | 77872 (15%) | |
30-39 Yrs | 3237 (17%) | 23655 (13%) | 70953 (13%) | |
40-49 Yrs | 2587 (14%) | 22369 (13%) | 67833 (13%) | |
50-59 Yrs | 2747 (15%) | 22205 (13%) | 61860 (12%) | |
60-69 Yrs | 2411 (13%) | 17564 (10%) | 47151 (9%) | |
70+ Yrs | 1639 (8%) | 13603 (7%) | 39738 (7%) | |
Median HH Income | $25,514 | $32,227 | $37,330 | |
Total Household Income | < 24K | 3812 (49%) | 25027 (40%) | 59819 (33%) |
25-49K | 1788 (23%) | 17203 (27%) | 53965 (30%) | |
50-74K | 886 (11%) | 8850 (14%) | 30466 (17%) | |
75-99K | 410 (5%) | 4737 (7%) | 16158 (9%) | |
100-199K | 672 (8%) | 5125 (8%) | 15922 (8%) | |
200K+ | 144 (1%) | 1320 (2%) | 2858 (1%) | |
Highest Education Level | No Diploma | 3092 | 32845 | 92476 |
Diploma or GED | 4628 | 35319 | 106822 | |
Some College | 3475 | 23632 | 68878 | |
Assoc. Degree | 815 | 5732 | 17562 | |
Bachelors Degree | 1693 | 10392 | 29961 | |
Higher Degree | 612 | 4420 | 12246 | |
Total Housing Units | 9,653 | 76,651 | 216,825 | |
--Owner-Occupied | 1,528 | 19,266 | 60,771 | |
--Renter-Occupied | 6,184 | 42,995 | 118,416 | |
Owner-Occupied Values | < 100K | 269 | 4484 | 13023 |
100-199K | 573 | 7592 | 25831 | |
200-299K | 422 | 4212 | 14627 | |
300-399K | 131 | 1121 | 3580 | |
400-499K | 71 | 657 | 1500 | |
500K+ | 63 | 1201 | 2210 | |
Total Working Age Population | 16,057 | 132,908 | 392,285 | |
In Work Force | 7,347 | 78,220 | 244,302 | |
Not In Work Force | 8,711 | 54,689 | 147,983 | |
Workforce Employed | 6,521 | 70,791 | 222,339 | |
Workforce Unemployed | 807 | 7,370 | 21,639 | |
Civlian Workforce | 7,328 | 78,161 | 243,977 | |
Military Workforce | 19 | 58 | 324 | |
Total Households | 7,712 | 62,262 | 179,187 | |
Family Households | 2,462 | 32,137 | 100,684 | |
Non-Family Households | 5,249 | 30,124 | 78,504 | |
Married Couple | 1,320 | 16,914 | 54,231 | |
Other Family | 1,142 | 15,223 | 46,453 | |
Married w/Child | 460 | 7,034 | 23,759 | |
Single Male w/Child | 107 | 2,080 | 6,345 | |
Single Female w/Child | 346 | 5,986 | 17,691 |
Population Change Last Two Decades - Plus Projection
2000 | % | 2010 | % | 2020 | % | 2030 | |
---|---|---|---|---|---|---|---|
Nevada | 1,998,257 | +35 | 2,700,551 | +17 | 3,149,234 | +10 | 3,460,728 |
Clark County | 1,375,765 | +42 | 1,951,269 | +19 | 2,318,174 | +10 | 2,550,048 |
Nye County | 32,485 | +35 | 43,946 | +11 | 48,864 | +8 | 52,587 |
Total Working Age Population:
Total Households:
Total Working Age Population:
Total Households:
Total Working Age Population:
Total Households: