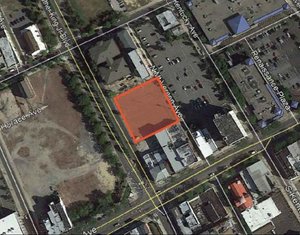
1-Mile | 3-Miles | 5-Miles | ||
---|---|---|---|---|
Total Population | 5,118 | 55,747 | 127,412 | |
Population Median Age | 45 | 39 | 39 | |
Population by Age | 0-9 Yrs | 403 (7%) | 5117 (9%) | 13796 (10%) |
10-19 Yrs | 633 (12%) | 8427 (15%) | 17321 (13%) | |
20-29 Yrs | 471 (9%) | 8801 (15%) | 18852 (14%) | |
30-39 Yrs | 490 (9%) | 5937 (10%) | 15030 (11%) | |
40-49 Yrs | 641 (12%) | 6836 (12%) | 15887 (12%) | |
50-59 Yrs | 867 (16%) | 7748 (13%) | 18289 (14%) | |
60-69 Yrs | 790 (15%) | 7308 (13%) | 15988 (12%) | |
70+ Yrs | 822 (16%) | 5572 (9%) | 12249 (9%) | |
Median HH Income | $82,455 | $93,593 | $87,892 | |
Total Household Income | < 24K | 174 (8%) | 2056 (10%) | 5141 (11%) |
25-49K | 416 (19%) | 2792 (14%) | 7018 (15%) | |
50-74K | 383 (17%) | 2623 (13%) | 6801 (15%) | |
75-99K | 361 (16%) | 2833 (14%) | 6553 (14%) | |
100-199K | 610 (28%) | 6539 (34%) | 14440 (32%) | |
200K+ | 217 (10%) | 2313 (12%) | 4726 (10%) | |
Highest Education Level | No Diploma | 102 | 1649 | 5140 |
Diploma or GED | 1095 | 10882 | 26198 | |
Some College | 815 | 7203 | 16578 | |
Assoc. Degree | 403 | 3387 | 8035 | |
Bachelors Degree | 1003 | 9180 | 20270 | |
Higher Degree | 434 | 4615 | 9913 | |
Total Housing Units | 2,271 | 20,451 | 47,887 | |
--Owner-Occupied | 1,765 | 15,777 | 35,202 | |
--Renter-Occupied | 395 | 3,379 | 9,477 | |
Owner-Occupied Values | < 100K | 73 | 455 | 1397 |
100-199K | 665 | 5272 | 12445 | |
200-299K | 664 | 6642 | 13815 | |
300-399K | 251 | 2397 | 5208 | |
400-499K | 60 | 664 | 1419 | |
500K+ | 52 | 346 | 918 | |
Total Working Age Population | 4,330 | 46,390 | 103,721 | |
In Work Force | 2,738 | 30,535 | 69,924 | |
Not In Work Force | 1,592 | 15,855 | 33,796 | |
Workforce Employed | 2,553 | 28,718 | 65,589 | |
Workforce Unemployed | 185 | 1,798 | 4,287 | |
Civlian Workforce | 2,738 | 30,516 | 69,876 | |
Military Workforce | 1 | 19 | 48 | |
Total Households | 2,160 | 19,156 | 44,679 | |
Family Households | 1,392 | 13,504 | 31,957 | |
Non-Family Households | 768 | 5,652 | 12,722 | |
Married Couple | 1,138 | 10,687 | 24,336 | |
Other Family | 254 | 2,817 | 7,621 | |
Married w/Child | 384 | 4,033 | 9,574 | |
Single Male w/Child | 27 | 270 | 820 | |
Single Female w/Child | 96 | 1,021 | 2,667 |
Population Change Last Two Decades - Plus Projection
2000 | % | 2010 | % | 2020 | % | 2030 | |
---|---|---|---|---|---|---|---|
New Jersey | 8,414,350 | +4 | 8,791,894 | +4 | 9,132,700 | +4 | 9,530,900 |
Burlington County | 423,394 | +6 | 448,734 | 0 | 450,000 | +3 | 464,900 |
Camden County | 508,932 | +1 | 513,657 | 0 | 511,800 | +2 | 521,000 |
Gloucester County | 254,673 | +13 | 288,288 | +1 | 292,000 | +5 | 305,800 |
Salem County | 64,285 | +3 | 66,083 | -5 | 63,000 | -3 | 61,000 |
Total Working Age Population:
Total Households:
Total Working Age Population:
Total Households:
Total Working Age Population:
Total Households: