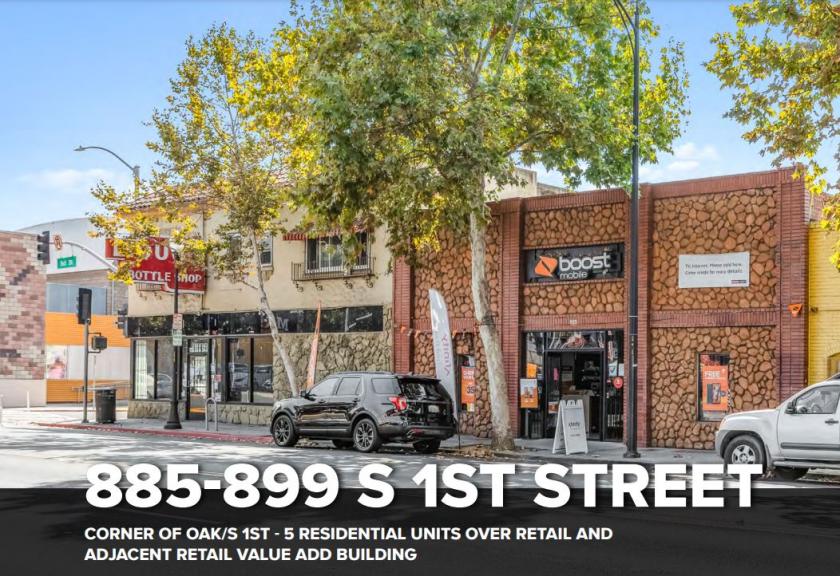
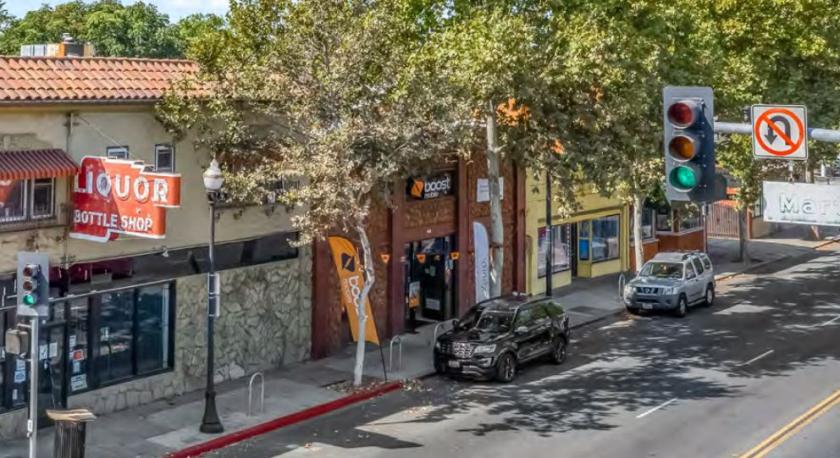
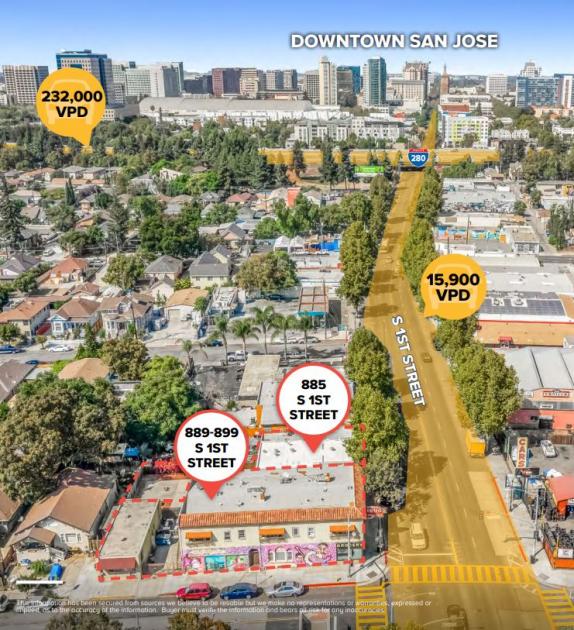
The two separately parceled assets are comprised as follows: 889-899 South 1st consists of one 5 unit residential complex with ground floor retail, currently leased to a fitness tenant, and a standalone office/retail building which is currently vacant. Together the total square footage is approximately 5,100 SF. The standalone office/retail building (located along Oak Street), per its Commercial Pedestrian zoning, may be eligible for conversion into a residential unit. 885 South 1st Street is a single-story retail store front building consisting of approximately 2,000 SF, and is currently vacant. 885 South 1st has a large open yard behind the building which may have the potential to be converted to parking by creating access from the adjacent parcel (889-899 South 1st). The combined lot square footage for both parcels is approximately 10,018 SF. The combination of two adjoining lots with three separate buildings makes this a rare and fungible investment opportunity, with upside potential.The subject property benefits from an array of commuter-friendly transportation options, as well as an influx of nearby commercial/residential developments (Google’s Downtown West project, Adobe and Apple) which have been attracting businesses and residents to the area. The adjacent Oak St & South 1st St bus stop serves the entire San Jose Metro, which connects commuters to the VTA Light Rail System. Additionally, drivers have ease of access to U.S. Highway 101, 87, 280 and 880.