Office Space
2345 Forest Avenue Chico, CA 95928
2345 Forest Avenue Chico, CA 95928
Details & Description
Property Highlights
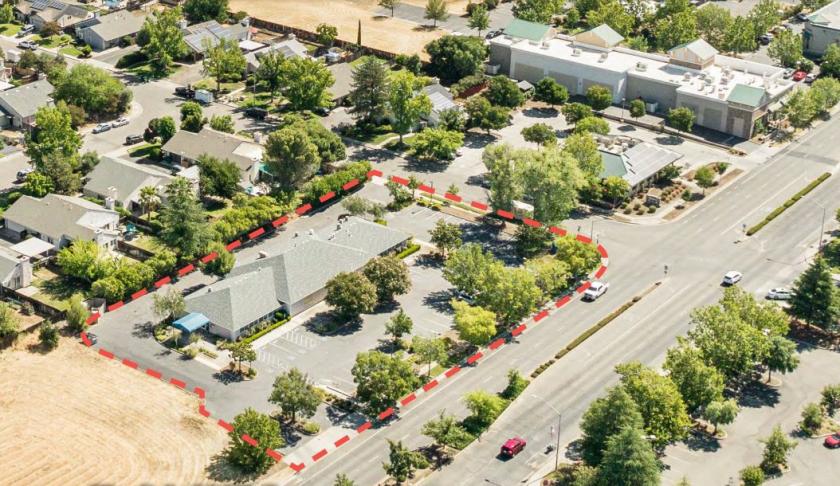
• Strong medical retail location with numerous national credit tenants surrounding the subject property
• Located just off of Highway 99 and only DaVita in the southern portion of Chico, CA
Listing Agents

Bryan Webb
O: 415-274-2700
M: 415-274-2717
bwebb@cppcre.com
O: 415-274-2700
M: 415-274-2717
bwebb@cppcre.com
While we strive to provide the most accurate information, all listing information, and demographic data, is provided by third-parties. As such, MyEListing will not be responsible for the accuracy of the information. It is strongly recommended that you verify all information with the listing agent, and any relevant agencies, prior to making any decisions.