Commercial Land
3000 North German Church Road Indianapolis, IN 46235
3000 North German Church Road Indianapolis, IN 46235

Details & Description
Property Highlights
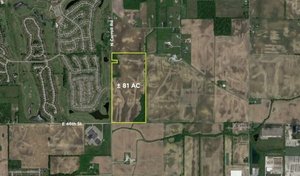
- • 9.8 acre development land zoned C-3
- • 54,152 households within 5 miles
- • Near rapidly growing Mt. Comfort corridor
- • Quick access to I-70 and 465
- • In a Qualified Census Tract
Listing Agents

Michael Horrigan
O: 317-439-3452
mhorrigan@bradleyco.com
O: 317-439-3452
mhorrigan@bradleyco.com
While we strive to provide the most accurate information, all listing information, and demographic data, is provided by third-parties. As such, MyEListing will not be responsible for the accuracy of the information. It is strongly recommended that you verify all information with the listing agent, and any relevant agencies, prior to making any decisions.