Commercial Land
4502 South Morristown Pike Greenfield, IN 46140
4502 South Morristown Pike Greenfield, IN 46140

Details & Description
Property Highlights
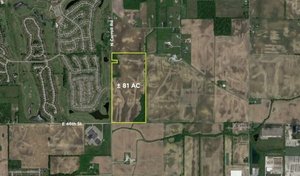
- • 15 acres available $18,000AC
- • Development potential on 15 AC
- • Build your own rural home
Listing Agents

Michael Horrigan
O: 317-439-3452
mhorrigan@bradleyco.com
O: 317-439-3452
mhorrigan@bradleyco.com
While we strive to provide the most accurate information, all listing information, and demographic data, is provided by third-parties. As such, MyEListing will not be responsible for the accuracy of the information. It is strongly recommended that you verify all information with the listing agent, and any relevant agencies, prior to making any decisions.