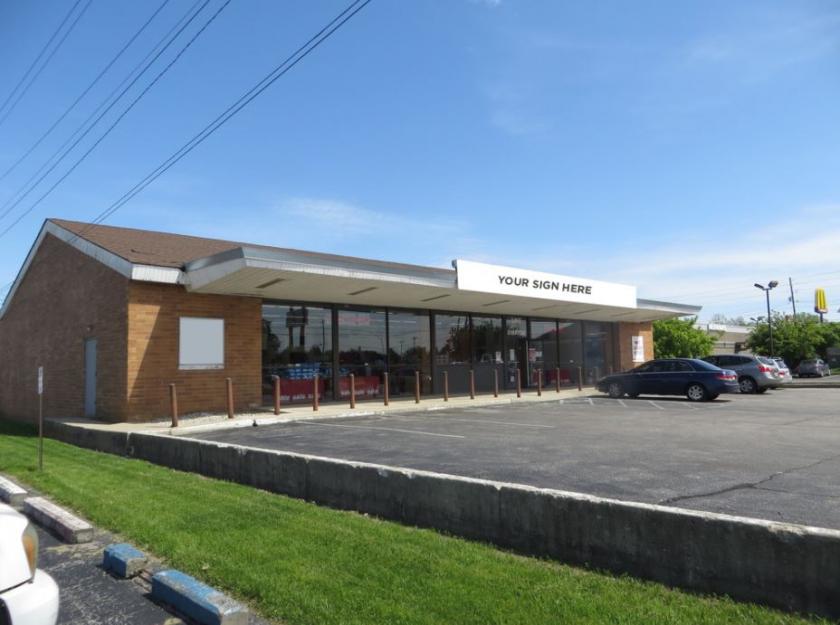
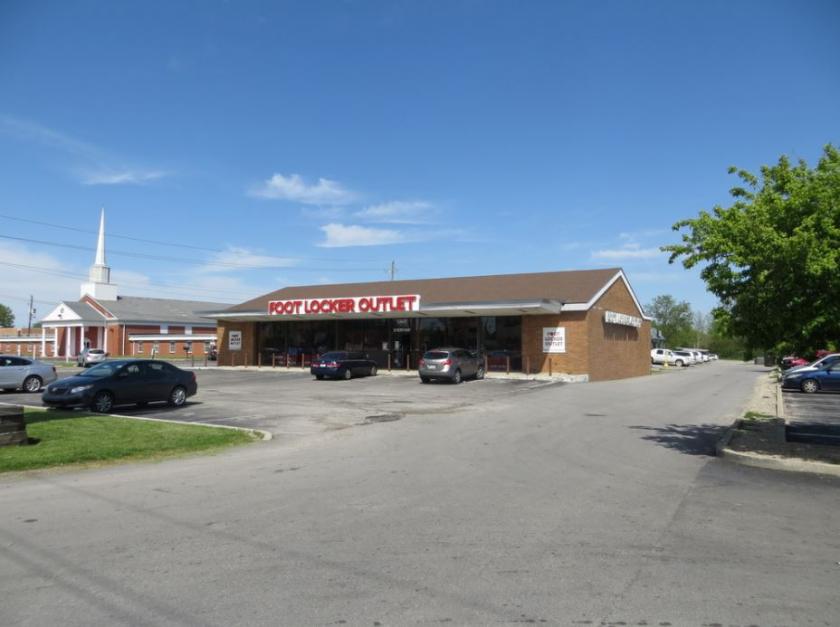
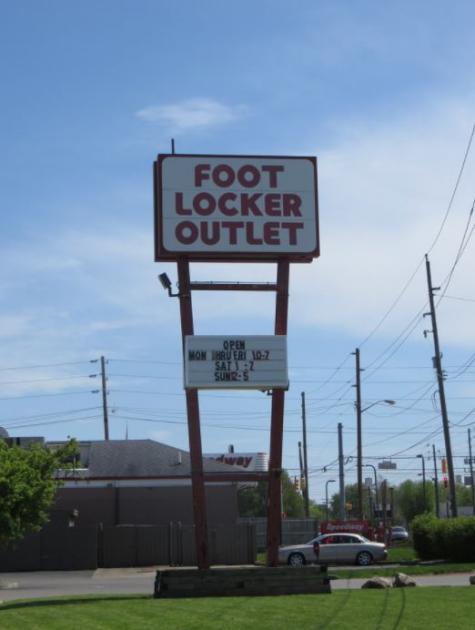
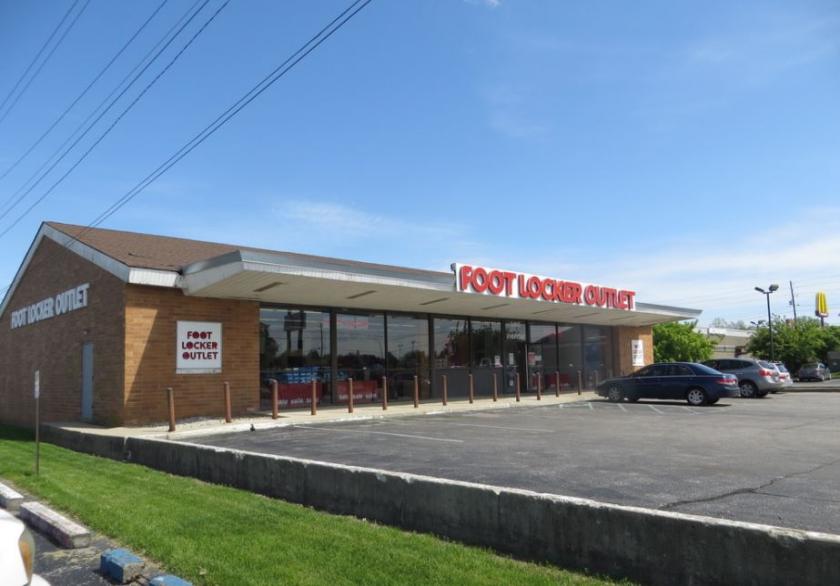
1-Mile | 3-Miles | 5-Miles | ||
---|---|---|---|---|
Total Population | 9,043 | 89,204 | 200,062 | |
Population Median Age | 37 | 35 | 34 | |
Population by Age | 0-9 Yrs | 1080 (11%) | 13769 (15%) | 32151 (16%) |
10-19 Yrs | 1390 (15%) | 12841 (14%) | 29182 (14%) | |
20-29 Yrs | 1421 (15%) | 14607 (16%) | 31218 (15%) | |
30-39 Yrs | 1201 (13%) | 11865 (13%) | 28841 (14%) | |
40-49 Yrs | 1004 (11%) | 11289 (12%) | 24041 (12%) | |
50-59 Yrs | 1047 (11%) | 10688 (11%) | 24300 (12%) | |
60-69 Yrs | 1053 (11%) | 7409 (8%) | 17525 (8%) | |
70+ Yrs | 846 (9%) | 6736 (7%) | 12804 (6%) | |
Median HH Income | $52,730 | $46,261 | $46,077 | |
Total Household Income | < 24K | 705 (20%) | 7627 (22%) | 16381 (22%) |
25-49K | 898 (26%) | 10392 (30%) | 22324 (31%) | |
50-74K | 777 (22%) | 6657 (19%) | 13765 (19%) | |
75-99K | 431 (12%) | 4318 (12%) | 8885 (12%) | |
100-199K | 500 (14%) | 4095 (12%) | 9100 (12%) | |
200K+ | 93 (2%) | 559 (1%) | 1433 (1%) | |
Highest Education Level | No Diploma | 706 | 7830 | 21183 |
Diploma or GED | 1921 | 16943 | 38155 | |
Some College | 1232 | 12683 | 25968 | |
Assoc. Degree | 621 | 5620 | 10841 | |
Bachelors Degree | 1106 | 8883 | 18643 | |
Higher Degree | 462 | 3999 | 8946 | |
Total Housing Units | 4,051 | 37,690 | 81,024 | |
--Owner-Occupied | 2,095 | 16,740 | 37,281 | |
--Renter-Occupied | 1,309 | 16,907 | 34,607 | |
Owner-Occupied Values | < 100K | 461 | 4905 | 13831 |
100-199K | 1537 | 10605 | 18833 | |
200-299K | 53 | 910 | 3275 | |
300-399K | 4 | 120 | 562 | |
400-499K | 0 | 4 | 226 | |
500K+ | 42 | 196 | 553 | |
Total Working Age Population | 6,991 | 67,639 | 149,599 | |
In Work Force | 4,680 | 46,119 | 100,934 | |
Not In Work Force | 2,311 | 21,520 | 48,665 | |
Workforce Employed | 4,547 | 43,526 | 94,689 | |
Workforce Unemployed | 133 | 2,582 | 6,208 | |
Civlian Workforce | 4,680 | 46,108 | 100,897 | |
Military Workforce | 0 | 11 | 37 | |
Total Households | 3,405 | 33,648 | 71,889 | |
Family Households | 2,053 | 19,524 | 43,739 | |
Non-Family Households | 1,352 | 14,123 | 28,150 | |
Married Couple | 1,435 | 11,528 | 25,384 | |
Other Family | 618 | 7,996 | 18,355 | |
Married w/Child | 574 | 5,025 | 11,270 | |
Single Male w/Child | 41 | 970 | 2,531 | |
Single Female w/Child | 243 | 3,804 | 8,447 |
Population Change Last Two Decades - Plus Projection
2000 | % | 2010 | % | 2020 | % | 2030 | |
---|---|---|---|---|---|---|---|
Indiana | 6,080,485 | +7 | 6,483,802 | +4 | 6,738,573 | +4 | 7,014,880 |
Hendricks County | 104,093 | +40 | 145,448 | +17 | 170,323 | +16 | 197,902 |
Marion County | 860,454 | +5 | 903,393 | +7 | 963,732 | +4 | 1,001,231 |
Total Working Age Population:
Total Households:
Total Working Age Population:
Total Households:
Total Working Age Population:
Total Households: