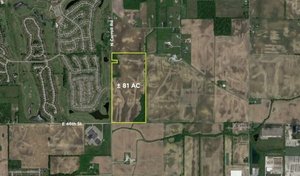
1-Mile | 3-Miles | 5-Miles | ||
---|---|---|---|---|
Total Population | 1,117 | 7,569 | 25,377 | |
Population Median Age | 38 | 38 | 38 | |
Population by Age | 0-9 Yrs | 176 (15%) | 1128 (14%) | 3509 (13%) |
10-19 Yrs | 138 (12%) | 1053 (13%) | 3680 (14%) | |
20-29 Yrs | 131 (11%) | 716 (9%) | 2624 (10%) | |
30-39 Yrs | 167 (14%) | 998 (13%) | 3507 (13%) | |
40-49 Yrs | 101 (9%) | 979 (12%) | 3748 (14%) | |
50-59 Yrs | 160 (14%) | 1147 (15%) | 3422 (13%) | |
60-69 Yrs | 104 (9%) | 763 (10%) | 2545 (10%) | |
70+ Yrs | 140 (12%) | 784 (10%) | 2342 (9%) | |
Median HH Income | $73,444 | $91,000 | $85,313 | |
Total Household Income | < 24K | 38 (9%) | 178 (6%) | 703 (7%) |
25-49K | 72 (17%) | 380 (14%) | 1567 (17%) | |
50-74K | 103 (24%) | 552 (20%) | 1782 (19%) | |
75-99K | 66 (15%) | 368 (13%) | 1268 (13%) | |
100-199K | 103 (24%) | 876 (32%) | 2987 (32%) | |
200K+ | 34 (8%) | 339 (12%) | 843 (9%) | |
Highest Education Level | No Diploma | 41 | 229 | 962 |
Diploma or GED | 173 | 1138 | 4048 | |
Some College | 225 | 1097 | 3266 | |
Assoc. Degree | 67 | 465 | 1636 | |
Bachelors Degree | 164 | 1451 | 4837 | |
Higher Degree | 94 | 742 | 2327 | |
Total Housing Units | 444 | 2,780 | 9,430 | |
--Owner-Occupied | 374 | 2,482 | 7,432 | |
--Renter-Occupied | 42 | 212 | 1,717 | |
Owner-Occupied Values | < 100K | 5 | 58 | 411 |
100-199K | 198 | 932 | 2876 | |
200-299K | 101 | 684 | 1963 | |
300-399K | 48 | 526 | 1448 | |
400-499K | 7 | 137 | 382 | |
500K+ | 15 | 146 | 352 | |
Total Working Age Population | 850 | 5,746 | 19,491 | |
In Work Force | 562 | 3,894 | 13,671 | |
Not In Work Force | 288 | 1,852 | 5,820 | |
Workforce Employed | 545 | 3,780 | 13,367 | |
Workforce Unemployed | 17 | 114 | 304 | |
Civlian Workforce | 562 | 3,894 | 13,671 | |
Military Workforce | 0 | 0 | 0 | |
Total Households | 416 | 2,693 | 9,149 | |
Family Households | 306 | 2,122 | 6,952 | |
Non-Family Households | 110 | 572 | 2,197 | |
Married Couple | 250 | 1,832 | 5,793 | |
Other Family | 56 | 289 | 1,158 | |
Married w/Child | 114 | 827 | 2,827 | |
Single Male w/Child | 4 | 36 | 175 | |
Single Female w/Child | 26 | 116 | 489 |
Population Change Last Two Decades - Plus Projection
2000 | % | 2010 | % | 2020 | % | 2030 | |
---|---|---|---|---|---|---|---|
Indiana | 6,080,485 | +7 | 6,483,802 | +4 | 6,738,573 | +4 | 7,014,880 |
Boone County | 46,107 | +23 | 56,640 | +25 | 70,556 | +19 | 83,749 |
Hendricks County | 104,093 | +40 | 145,448 | +17 | 170,323 | +16 | 197,902 |
Total Working Age Population:
Total Households:
Total Working Age Population:
Total Households:
Total Working Age Population:
Total Households: