Commercial Land
8843 West 700 South Pendleton, IN 46064
8843 West 700 South Pendleton, IN 46064

Details & Description
Property Highlights
- • Sale Price Subject to Offer
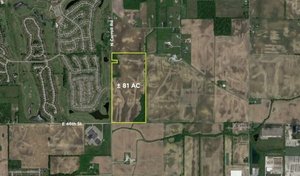
- • 15 acres of prime development ground
- • Growing area - hard corner location
- • Utilities at or near site
- • Flat topography with good access
- • Many potential uses for this desirable site
Listing Agents

Michael Horrigan
O: 317-439-3452
mhorrigan@bradleyco.com
O: 317-439-3452
mhorrigan@bradleyco.com
While we strive to provide the most accurate information, all listing information, and demographic data, is provided by third-parties. As such, MyEListing will not be responsible for the accuracy of the information. It is strongly recommended that you verify all information with the listing agent, and any relevant agencies, prior to making any decisions.