Industrial Properties
111 East Broad Street South Whitley, IN 46787
111 East Broad Street South Whitley, IN 46787

Details & Description
Property Highlights
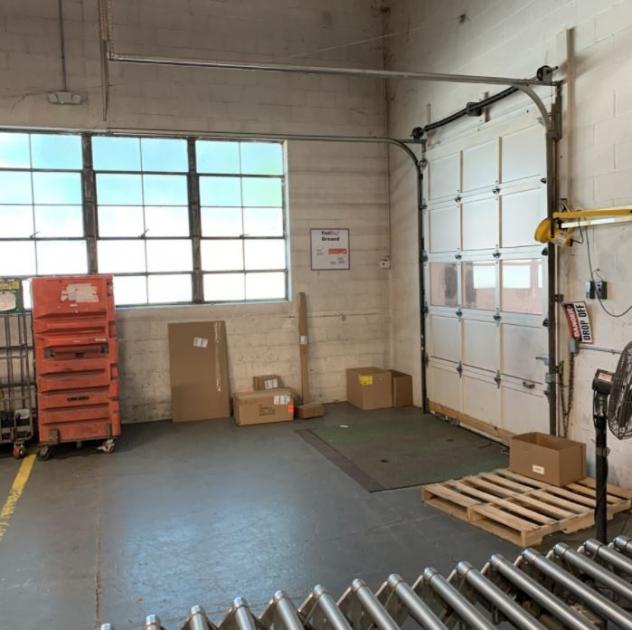
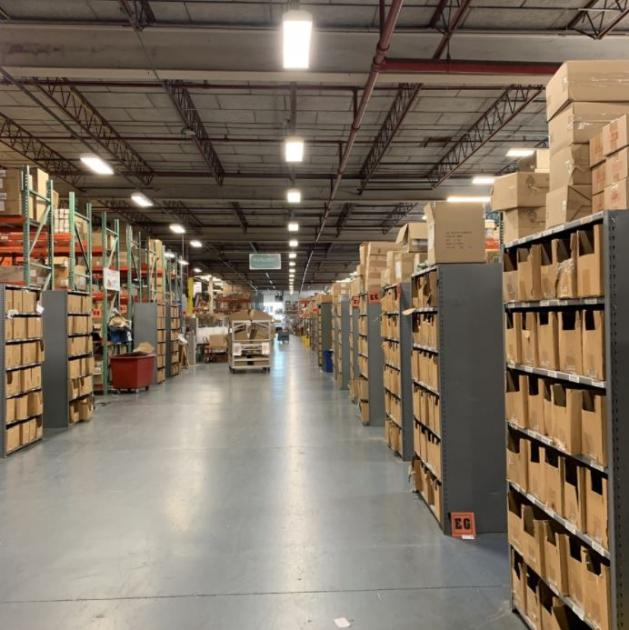
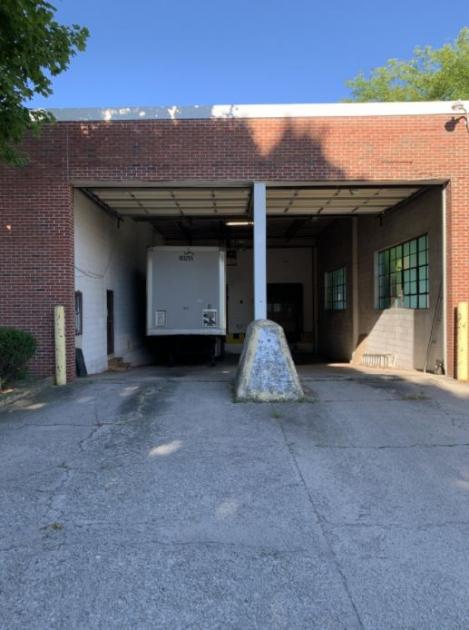
- • 117,004 SF industrial building available
- • First floor 104,172 SF
- • Second floor 12,832 SF unfinished
- • Fully heated and partially air conditioned
- • Zoned light industrial
- • Located within a TIF district
Additional Photos

Listing Agents

Martin Huttenlocker
Bradley Company
O: 260-423-4311
mhuttenlocker@bradleyco.com
Bradley Company
O: 260-423-4311
mhuttenlocker@bradleyco.com
While we strive to provide the most accurate information, all listing information, and demographic data, is provided by third-parties. As such, MyEListing will not be responsible for the accuracy of the information. It is strongly recommended that you verify all information with the listing agent, and any relevant agencies, prior to making any decisions.


