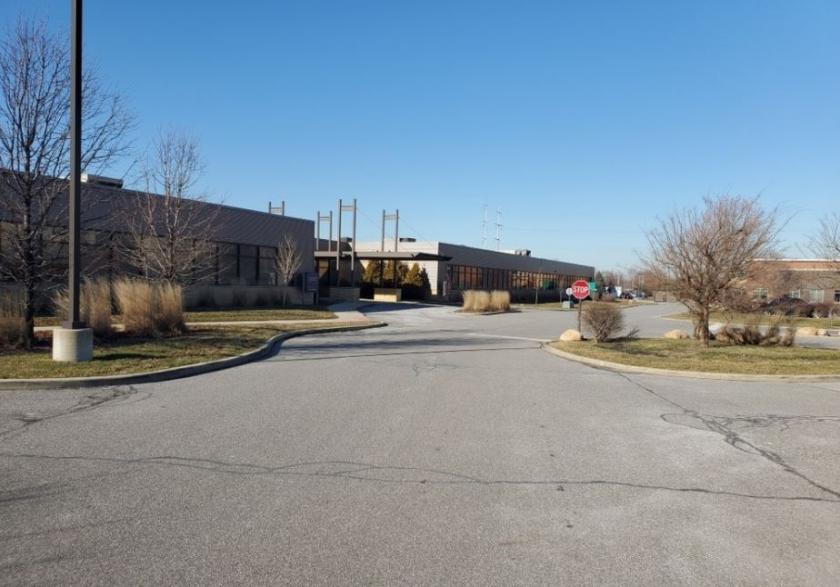
Office Space
9200 Calumet Avenue Munster, IN 46321
9200 Calumet Avenue Munster, IN 46321

Details & Description
Property Highlights
- • Upgraded lobby and common areas
- • On-site maintenance
- • Immediate occupancy available
- • Tenant improvement allowance negotiable
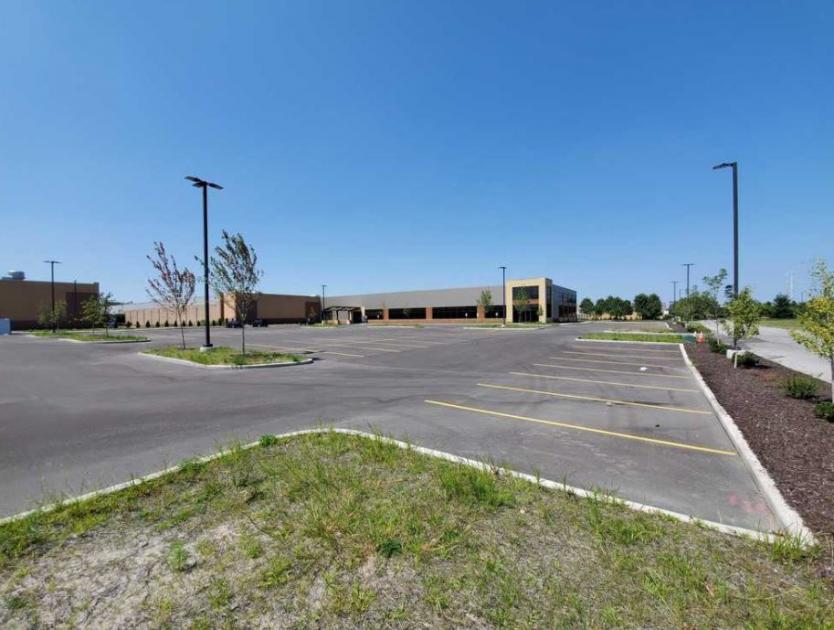
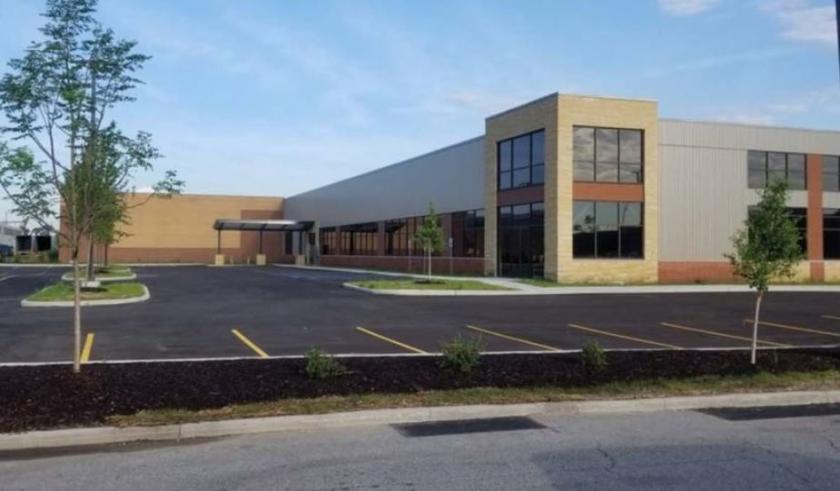
Additional Photos

Listing Agents

Steve Nicksic
O: 219-695-3160
M: 219-508-0554
snicksic@bradleyco.com
O: 219-695-3160
M: 219-508-0554
snicksic@bradleyco.com
While we strive to provide the most accurate information, all listing information, and demographic data, is provided by third-parties. As such, MyEListing will not be responsible for the accuracy of the information. It is strongly recommended that you verify all information with the listing agent, and any relevant agencies, prior to making any decisions.


