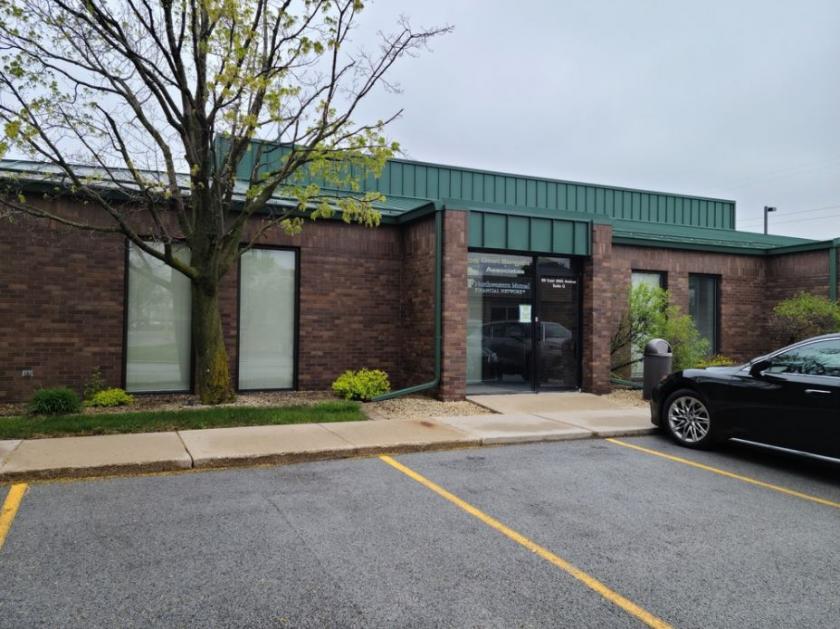
1-Mile | 3-Miles | 5-Miles | ||
---|---|---|---|---|
Total Population | 3,247 | 36,243 | 92,141 | |
Population Median Age | 44 | 40 | 40 | |
Population by Age | 0-9 Yrs | 307 (9%) | 4247 (11%) | 10361 (11%) |
10-19 Yrs | 273 (8%) | 4326 (11%) | 13040 (14%) | |
20-29 Yrs | 470 (14%) | 4613 (12%) | 10800 (11%) | |
30-39 Yrs | 403 (12%) | 5295 (14%) | 11949 (12%) | |
40-49 Yrs | 396 (12%) | 4973 (13%) | 12620 (13%) | |
50-59 Yrs | 361 (11%) | 4454 (12%) | 12175 (13%) | |
60-69 Yrs | 432 (13%) | 3783 (10%) | 10751 (11%) | |
70+ Yrs | 605 (18%) | 4551 (12%) | 10446 (11%) | |
Median HH Income | $56,958 | $63,398 | $65,024 | |
Total Household Income | < 24K | 250 (15%) | 2492 (16%) | 5931 (16%) |
25-49K | 416 (25%) | 3183 (21%) | 7659 (21%) | |
50-74K | 391 (24%) | 3225 (21%) | 7090 (19%) | |
75-99K | 296 (18%) | 2639 (17%) | 5524 (15%) | |
100-199K | 237 (14%) | 2956 (19%) | 8488 (23%) | |
200K+ | 23 (1%) | 437 (2%) | 1256 (3%) | |
Highest Education Level | No Diploma | 217 | 2501 | 5215 |
Diploma or GED | 840 | 8573 | 20946 | |
Some College | 537 | 5938 | 14356 | |
Assoc. Degree | 156 | 2014 | 5758 | |
Bachelors Degree | 469 | 4132 | 11127 | |
Higher Degree | 253 | 2412 | 6073 | |
Total Housing Units | 1,710 | 15,821 | 38,544 | |
--Owner-Occupied | 680 | 9,840 | 25,797 | |
--Renter-Occupied | 932 | 5,091 | 10,153 | |
Owner-Occupied Values | < 100K | 62 | 1359 | 3685 |
100-199K | 520 | 6245 | 13351 | |
200-299K | 74 | 1617 | 5858 | |
300-399K | 6 | 348 | 1888 | |
400-499K | 2 | 50 | 346 | |
500K+ | 16 | 221 | 667 | |
Total Working Age Population | 2,781 | 29,330 | 73,900 | |
In Work Force | 1,637 | 18,600 | 47,593 | |
Not In Work Force | 1,144 | 10,730 | 26,308 | |
Workforce Employed | 1,499 | 17,482 | 44,690 | |
Workforce Unemployed | 138 | 1,109 | 2,886 | |
Civlian Workforce | 1,637 | 18,591 | 47,575 | |
Military Workforce | 0 | 9 | 17 | |
Total Households | 1,613 | 14,931 | 35,950 | |
Family Households | 680 | 8,815 | 23,248 | |
Non-Family Households | 932 | 6,116 | 12,702 | |
Married Couple | 452 | 6,362 | 16,853 | |
Other Family | 228 | 2,453 | 6,395 | |
Married w/Child | 168 | 2,495 | 6,740 | |
Single Male w/Child | 72 | 374 | 841 | |
Single Female w/Child | 49 | 935 | 2,582 |
Population Change Last Two Decades - Plus Projection
2000 | % | 2010 | % | 2020 | % | 2030 | |
---|---|---|---|---|---|---|---|
Illinois | 12,419,293 | +3 | 12,830,632 | +12 | 14,316,487 | +6 | 15,138,849 |
Cook County | 5,376,741 | -3 | 5,194,675 | +10 | 5,707,832 | +5 | 5,990,243 |
Indiana | 6,080,485 | +7 | 6,483,802 | +4 | 6,738,573 | +4 | 7,014,880 |
Lake County | 484,564 | +2 | 496,005 | -3 | 479,815 | +1 | 482,321 |
Total Working Age Population:
Total Households:
Total Working Age Population:
Total Households:
Total Working Age Population:
Total Households: