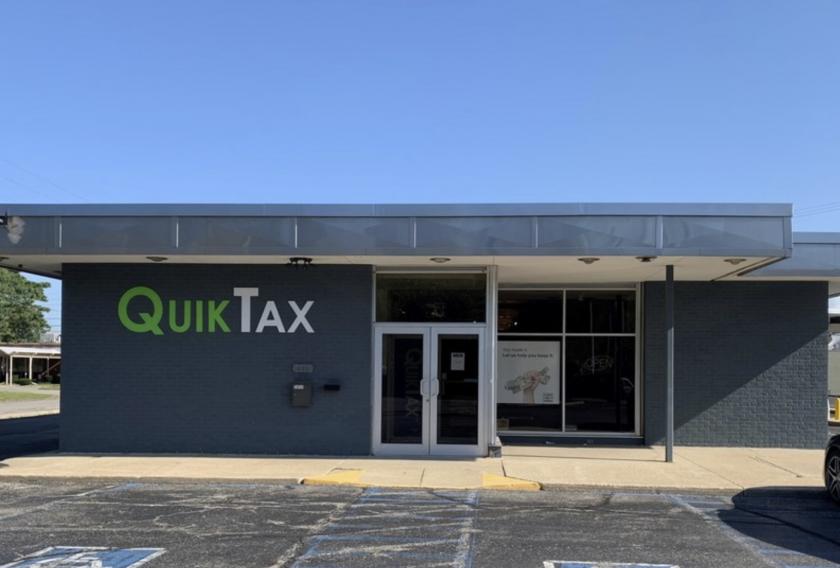
Office Space
3617 McKinley Avenue South Bend, IN 46615
3617 McKinley Avenue South Bend, IN 46615
Details & Description
Property Highlights
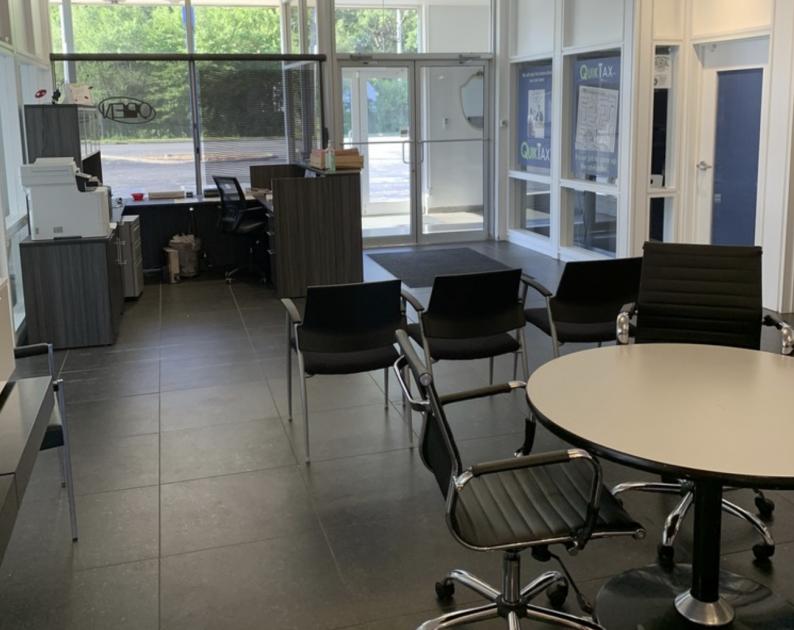
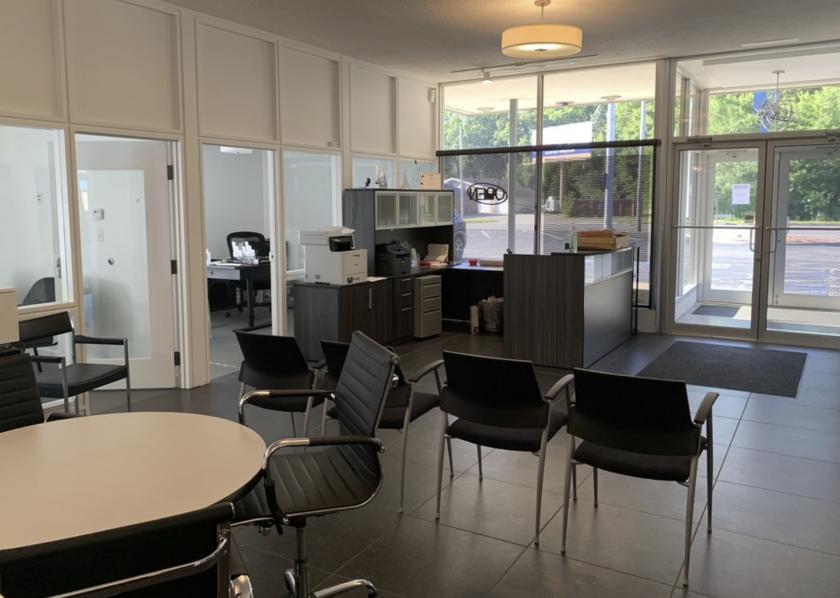
• Features 4 privates offices, conference room, reception desk, open work area, break room, bank vault, and fireplace.
• Well-positioned in the center of St. Joseph County, attracting residents from all primary trade areas
Listing Agents

John Jessen
O: 574-968-9270
M: 574-210-8773
jjessen@bradleyco.com
O: 574-968-9270
M: 574-210-8773
jjessen@bradleyco.com
While we strive to provide the most accurate information, all listing information, and demographic data, is provided by third-parties. As such, MyEListing will not be responsible for the accuracy of the information. It is strongly recommended that you verify all information with the listing agent, and any relevant agencies, prior to making any decisions.