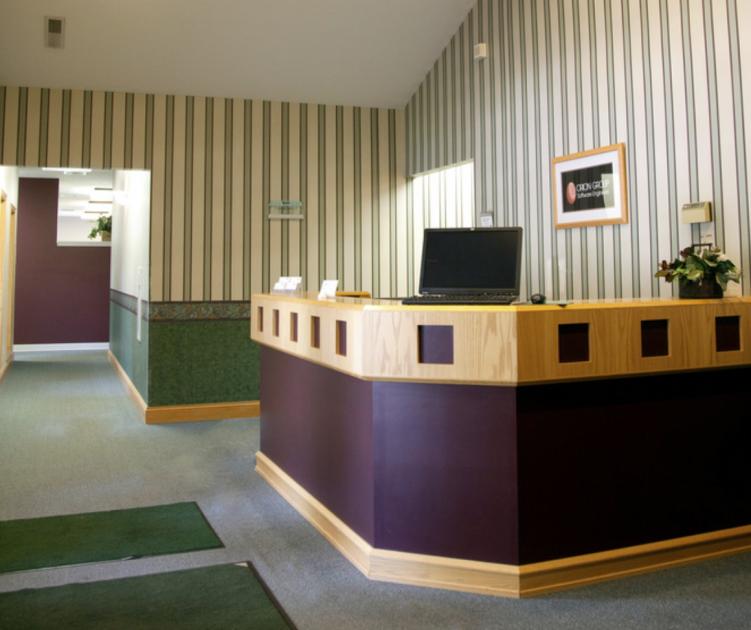
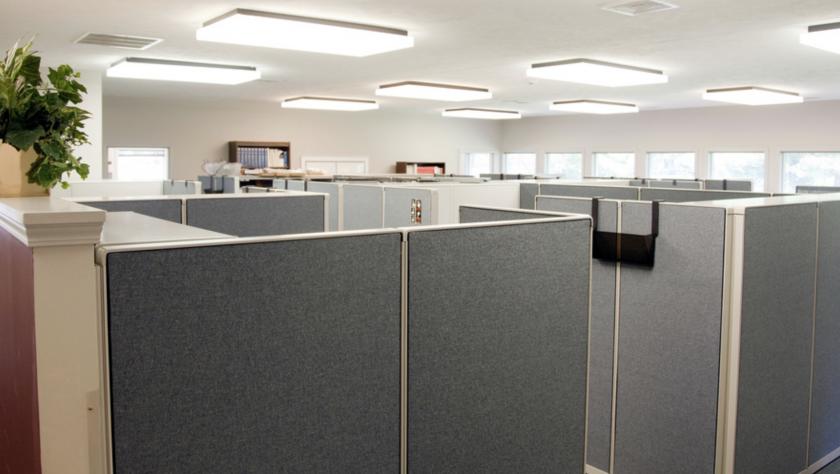
1-Mile | 3-Miles | 5-Miles | ||
---|---|---|---|---|
Total Population | 717 | 15,274 | 69,613 | |
Population Median Age | 42 | 40 | 37 | |
Population by Age | 0-9 Yrs | 47 (6%) | 2027 (13%) | 9269 (13%) |
10-19 Yrs | 100 (13%) | 1634 (10%) | 10716 (15%) | |
20-29 Yrs | 46 (6%) | 1713 (11%) | 11140 (16%) | |
30-39 Yrs | 105 (14%) | 2174 (14%) | 8461 (12%) | |
40-49 Yrs | 187 (26%) | 2249 (14%) | 7906 (11%) | |
50-59 Yrs | 75 (10%) | 1820 (11%) | 7879 (11%) | |
60-69 Yrs | 87 (12%) | 1941 (12%) | 7580 (10%) | |
70+ Yrs | 70 (9%) | 1716 (11%) | 6661 (9%) | |
Median HH Income | $81,463 | $53,426 | $44,084 | |
Total Household Income | < 24K | 33 (11%) | 1244 (20%) | 6594 (26%) |
25-49K | 35 (12%) | 1658 (26%) | 6765 (27%) | |
50-74K | 50 (17%) | 1016 (16%) | 4561 (18%) | |
75-99K | 88 (31%) | 861 (14%) | 2569 (10%) | |
100-199K | 59 (20%) | 1157 (18%) | 3340 (13%) | |
200K+ | 18 (6%) | 205 (3%) | 663 (2%) | |
Highest Education Level | No Diploma | 41 | 1209 | 7235 |
Diploma or GED | 182 | 3796 | 14629 | |
Some College | 127 | 2180 | 8551 | |
Assoc. Degree | 32 | 837 | 3127 | |
Bachelors Degree | 119 | 2023 | 5868 | |
Higher Degree | 67 | 954 | 3938 | |
Total Housing Units | 284 | 6,975 | 28,681 | |
--Owner-Occupied | 278 | 4,293 | 16,499 | |
--Renter-Occupied | 6 | 1,849 | 7,993 | |
Owner-Occupied Values | < 100K | 31 | 1573 | 8508 |
100-199K | 206 | 1907 | 5792 | |
200-299K | 24 | 499 | 1377 | |
300-399K | 4 | 109 | 327 | |
400-499K | 0 | 78 | 186 | |
500K+ | 12 | 127 | 309 | |
Total Working Age Population | 598 | 12,023 | 54,533 | |
In Work Force | 394 | 8,050 | 33,652 | |
Not In Work Force | 205 | 3,973 | 20,881 | |
Workforce Employed | 381 | 7,685 | 31,596 | |
Workforce Unemployed | 12 | 364 | 2,033 | |
Civlian Workforce | 394 | 8,050 | 33,629 | |
Military Workforce | 0 | 1 | 23 | |
Total Households | 283 | 6,142 | 24,492 | |
Family Households | 186 | 3,885 | 15,503 | |
Non-Family Households | 98 | 2,257 | 8,990 | |
Married Couple | 170 | 2,827 | 10,307 | |
Other Family | 15 | 1,058 | 5,196 | |
Married w/Child | 76 | 1,110 | 4,046 | |
Single Male w/Child | 5 | 69 | 485 | |
Single Female w/Child | 3 | 529 | 2,664 |
Population Change Last Two Decades - Plus Projection
2000 | % | 2010 | % | 2020 | % | 2030 | |
---|---|---|---|---|---|---|---|
Indiana | 6,080,485 | +7 | 6,483,802 | +4 | 6,738,573 | +4 | 7,014,880 |
St. Joseph County | 265,559 | +1 | 266,931 | +1 | 269,113 | +1 | 271,912 |
Michigan | 9,938,444 | -1 | 9,883,640 | +1 | 10,023,423 | +4 | 10,424,510 |
Berrien County | 162,453 | -3 | 156,813 | -2 | 153,154 | +2 | 156,590 |
Total Working Age Population:
Total Households:
Total Working Age Population:
Total Households:
Total Working Age Population:
Total Households: