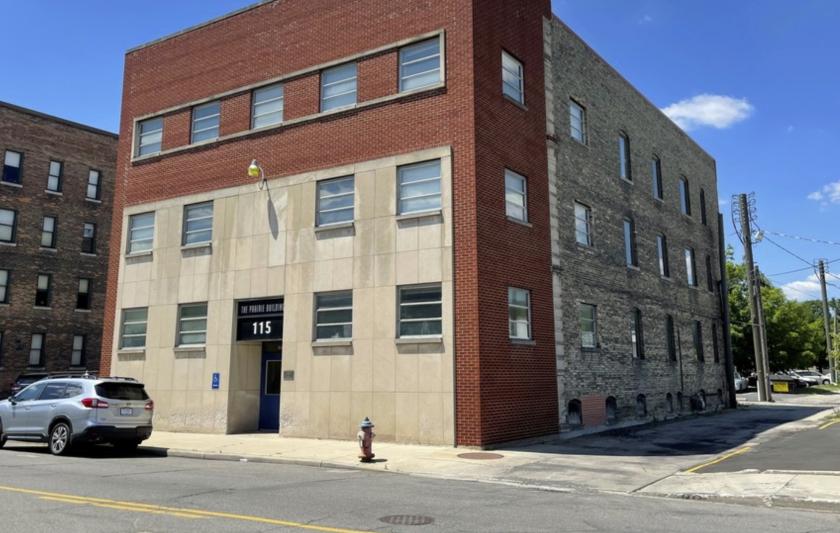
1-Mile | 3-Miles | 5-Miles | ||
---|---|---|---|---|
Total Population | 9,933 | 89,660 | 169,367 | |
Population Median Age | 36 | 33 | 37 | |
Population by Age | 0-9 Yrs | 1330 (13%) | 12212 (13%) | 21527 (12%) |
10-19 Yrs | 1261 (12%) | 15978 (17%) | 25276 (14%) | |
20-29 Yrs | 1999 (20%) | 18136 (20%) | 29684 (17%) | |
30-39 Yrs | 1344 (13%) | 11133 (12%) | 21299 (12%) | |
40-49 Yrs | 1092 (10%) | 10058 (11%) | 18699 (11%) | |
50-59 Yrs | 1042 (10%) | 8520 (9%) | 18250 (10%) | |
60-69 Yrs | 1136 (11%) | 7588 (8%) | 18520 (10%) | |
70+ Yrs | 729 (7%) | 6036 (6%) | 16112 (9%) | |
Median HH Income | $29,018 | $38,848 | $42,605 | |
Total Household Income | < 24K | 1811 (43%) | 9778 (32%) | 18394 (28%) |
25-49K | 985 (23%) | 8415 (27%) | 17832 (27%) | |
50-74K | 615 (14%) | 5572 (18%) | 12037 (18%) | |
75-99K | 294 (7%) | 2759 (9%) | 6642 (10%) | |
100-199K | 341 (8%) | 3004 (9%) | 7731 (12%) | |
200K+ | 77 (1%) | 685 (2%) | 1467 (2%) | |
Highest Education Level | No Diploma | 1142 | 8572 | 14943 |
Diploma or GED | 1491 | 15255 | 33625 | |
Some College | 1421 | 10127 | 21815 | |
Assoc. Degree | 379 | 3261 | 7763 | |
Bachelors Degree | 817 | 7267 | 16272 | |
Higher Degree | 972 | 5719 | 11722 | |
Total Housing Units | 5,331 | 37,617 | 76,333 | |
--Owner-Occupied | 1,460 | 16,540 | 36,979 | |
--Renter-Occupied | 2,663 | 13,672 | 27,125 | |
Owner-Occupied Values | < 100K | 905 | 11374 | 19885 |
100-199K | 398 | 3699 | 13159 | |
200-299K | 100 | 650 | 2078 | |
300-399K | 23 | 392 | 1054 | |
400-499K | 4 | 137 | 250 | |
500K+ | 30 | 289 | 553 | |
Total Working Age Population | 7,796 | 69,642 | 134,194 | |
In Work Force | 4,501 | 42,623 | 83,498 | |
Not In Work Force | 3,295 | 27,020 | 50,696 | |
Workforce Employed | 4,081 | 39,727 | 78,708 | |
Workforce Unemployed | 420 | 2,851 | 4,691 | |
Civlian Workforce | 4,501 | 42,578 | 83,399 | |
Military Workforce | 0 | 45 | 98 | |
Total Households | 4,123 | 30,212 | 64,104 | |
Family Households | 1,761 | 17,301 | 36,282 | |
Non-Family Households | 2,363 | 12,911 | 27,822 | |
Married Couple | 900 | 9,797 | 23,455 | |
Other Family | 861 | 7,504 | 12,827 | |
Married w/Child | 345 | 4,222 | 8,863 | |
Single Male w/Child | 98 | 832 | 1,450 | |
Single Female w/Child | 484 | 3,839 | 6,051 |
Population Change Last Two Decades - Plus Projection
2000 | % | 2010 | % | 2020 | % | 2030 | |
---|---|---|---|---|---|---|---|
Indiana | 6,080,485 | +7 | 6,483,802 | +4 | 6,738,573 | +4 | 7,014,880 |
St. Joseph County | 265,559 | +1 | 266,931 | +1 | 269,113 | +1 | 271,912 |
Total Working Age Population:
Total Households:
Total Working Age Population:
Total Households:
Total Working Age Population:
Total Households: