Retail Space
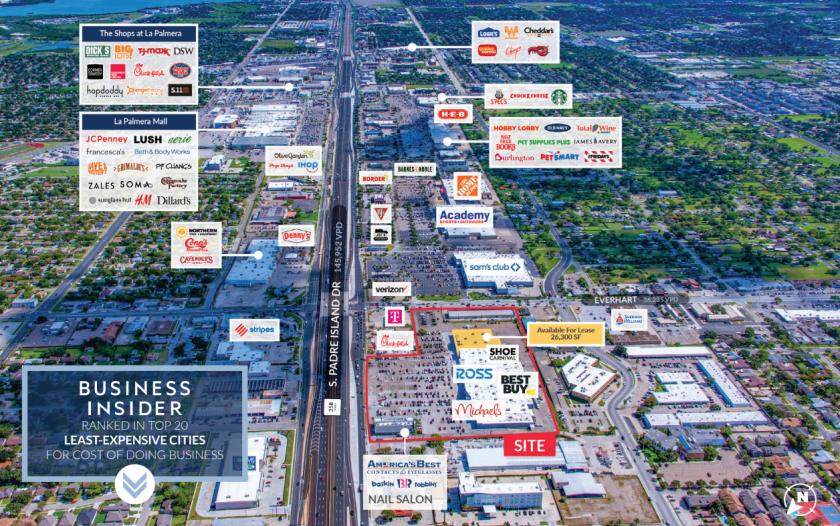
4717 South Padre Island Drive Corpus Christi, TX 78411
4717 South Padre Island Drive Corpus Christi, TX 78411
Details & Description
Property Highlights
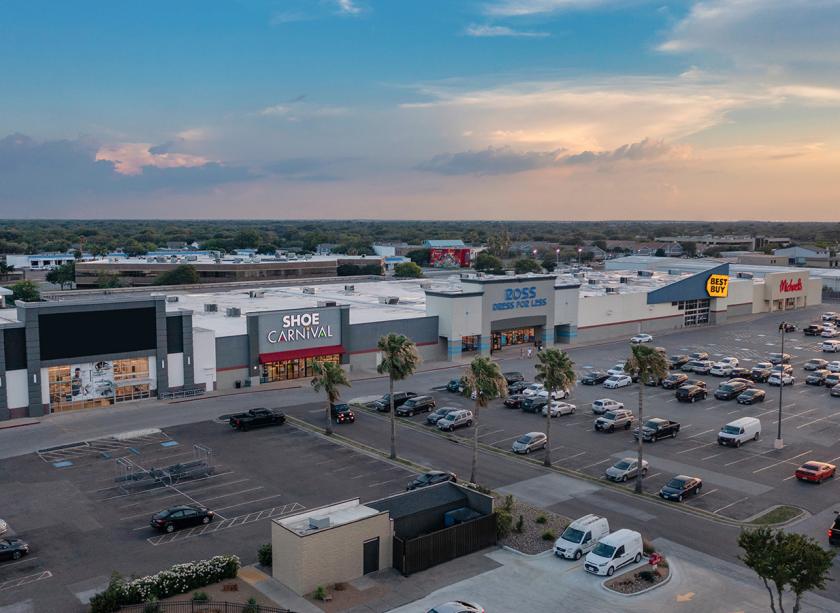
- • 26,300-SF Junior Anchor
- • Over 182K VPD at intersection
- • 240K+ residents within a 5-mile radius
Listing Agents

Bob Conwell
O: 281-477-4324
bconwell@newquest.com
O: 281-477-4324
bconwell@newquest.com
While we strive to provide the most accurate information, all listing information, and demographic data, is provided by third-parties. As such, MyEListing will not be responsible for the accuracy of the information. It is strongly recommended that you verify all information with the listing agent, and any relevant agencies, prior to making any decisions.