• 7,083 SF Gross 2–Story Building (CH Records)
• 16,413 SF Land area (.38 ac)
FEATURES
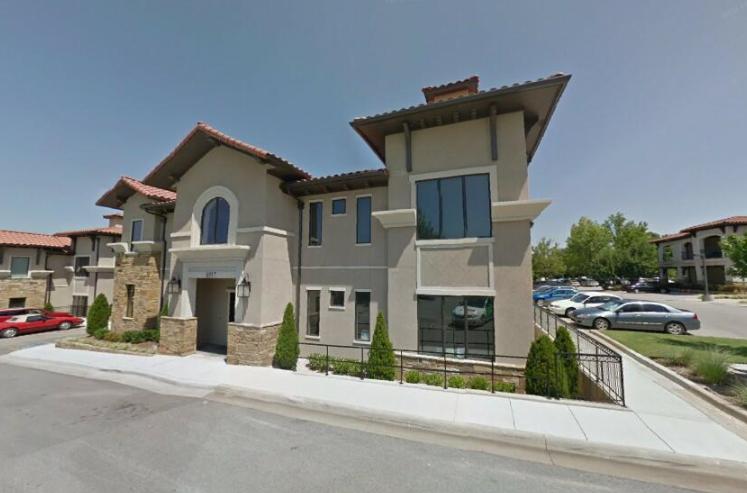
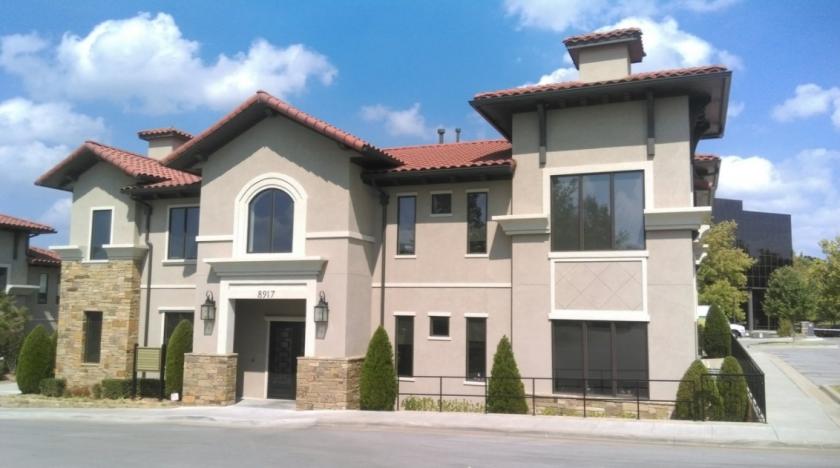
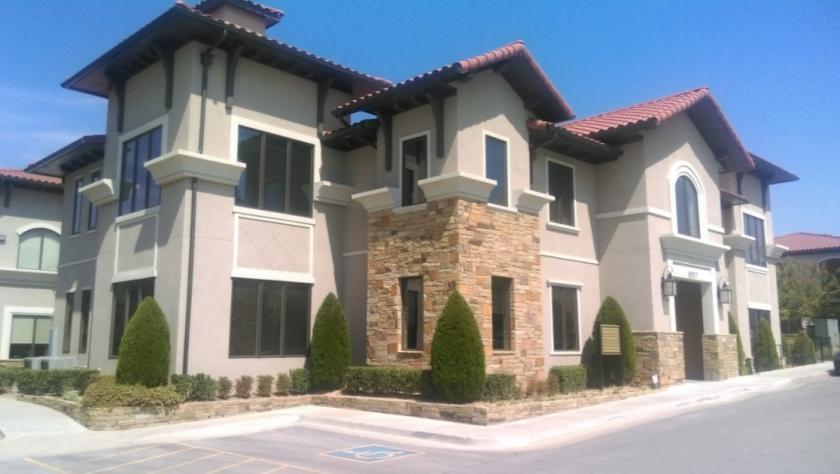
• Premier Tuscana on Yale Office Park
• 2013 Construction, natural stone and stucco exterior
• Architect/Owner space design services available free of charge
• Zoned CS (Commercial Shopping)
• Elevator to building
• New directory/tenant plaque signage
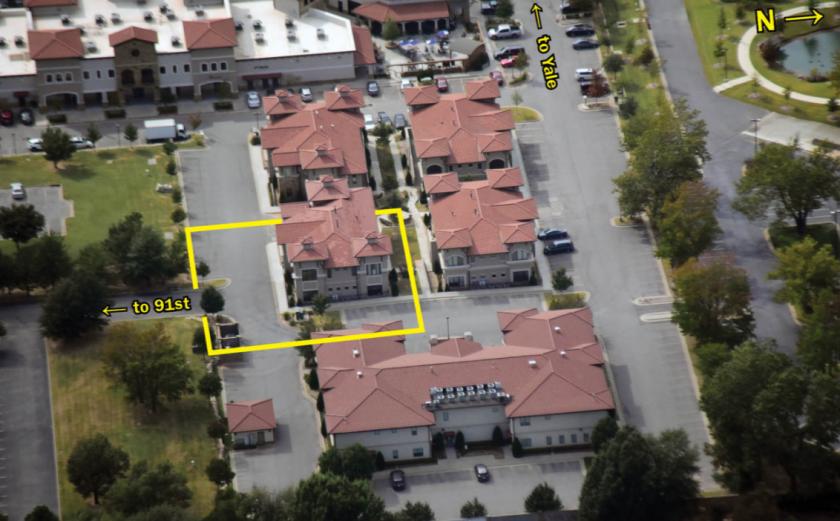
• Common landscaped courtyards
• Walkability to restaurants/retail services nearby
• Convenient 1/4 mile proximity to Creek Turnpike
Investment Highlights
• 3-New long term leases to ground floor
• Low maintenance costs/easy self-management
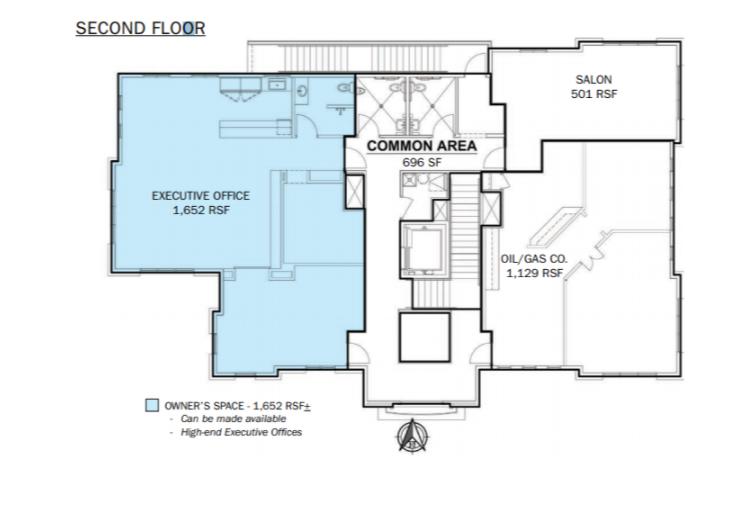
• 2nd floor partial or full floor owner/user potential
• 74% Occupancy, $80,000 ±
• Favorable occupancy costs at/below market rents
• Financial detail upon request
No part of this information may be copied, reproduced, repurposed, or screen-captured for any commercial purpose without prior written authorization from MyEListing.
While we strive to provide the most accurate information, all listing information, and demographic data, is provided by third-parties. As such, MyEListing will not be responsible for the accuracy of the information. It is strongly recommended that you verify all information with the listing agent, and any relevant agencies, prior to making any decisions.
What is the asking price for 8917 South Yale Avenue in Tulsa?
The asking price for 8917 South Yale Avenue is $1,249,000
What is the building size of this Office property in Tulsa, OK?
The size of the building/unit at 8917 South Yale Avenue in Tulsa is 1,652 square feet
How much land does the Tulsa, OK property at 8917 South Yale Avenue include?
8917 South Yale Avenue in Tulsa includes 0.380 acres of land
What kind of Office is the propery at 8917 South Yale Avenue?
The property at 8917 South Yale Avenue Tulsa, OK 74137 is listed as a Professional Office property
What is the population within 1 mile of 8917 South Yale Avenue in Tulsa?
The population within 1 mile of 8917 South Yale Avenue Tulsa, OK 74137 is 8,903 people.
Who do I contact for questions about 8917 South Yale Avenue?
You should contact the listing agent,
Marco Placencia, for any details regarding this commercial listing.