Industrial Properties
2221 Niagara Falls Boulevard Niagara Falls, NY 14304
2221 Niagara Falls Boulevard Niagara Falls, NY 14304
Details & Description
Property Highlights
- • Attractive rates
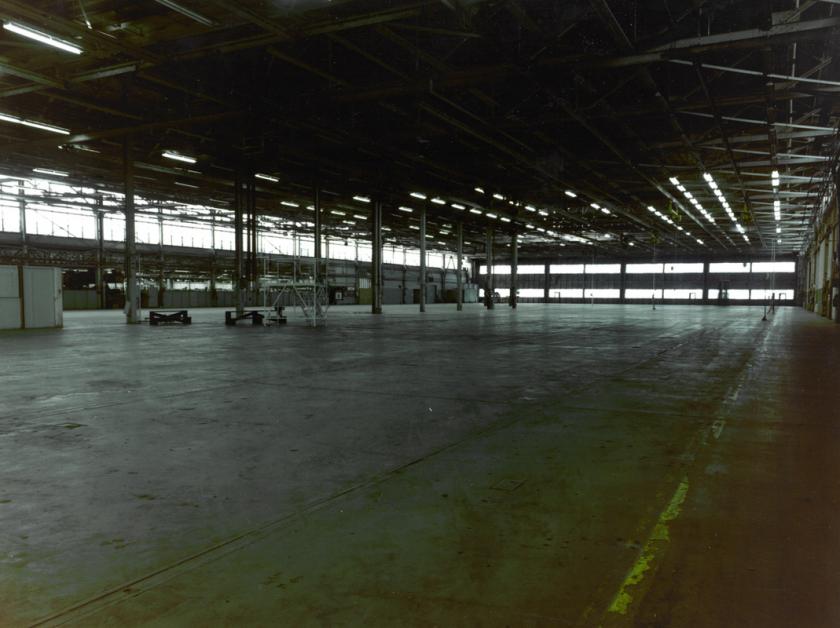
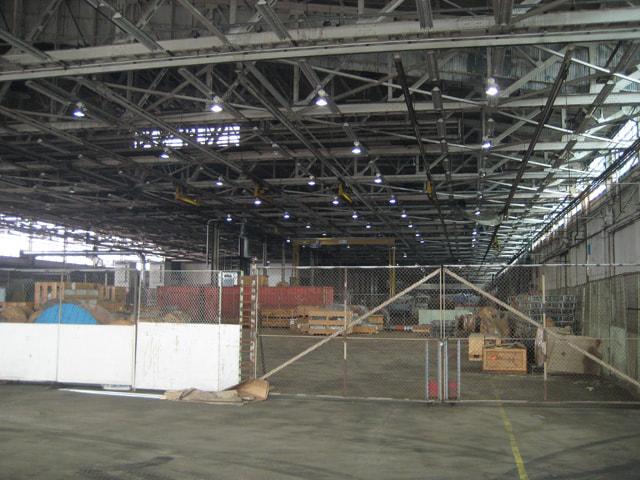
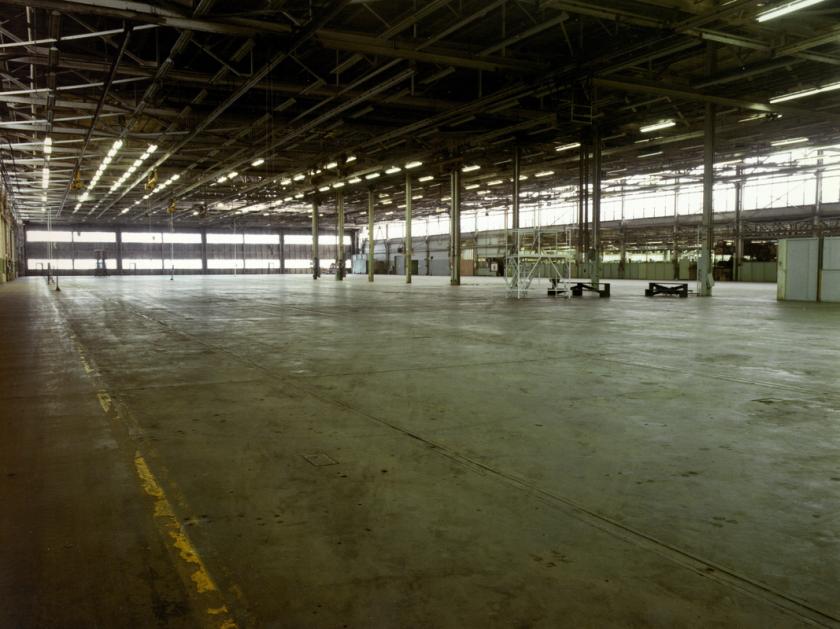
- • Manufacturing space with primary power
- • Loading at truck level and grade
- • Up to 250,000 SF available, will divide
Listing Agents

Michael Alpern
O: 716-856-2872
michaela@militello.com
O: 716-856-2872
michaela@militello.com
While we strive to provide the most accurate information, all listing information, and demographic data, is provided by third-parties. As such, MyEListing will not be responsible for the accuracy of the information. It is strongly recommended that you verify all information with the listing agent, and any relevant agencies, prior to making any decisions.